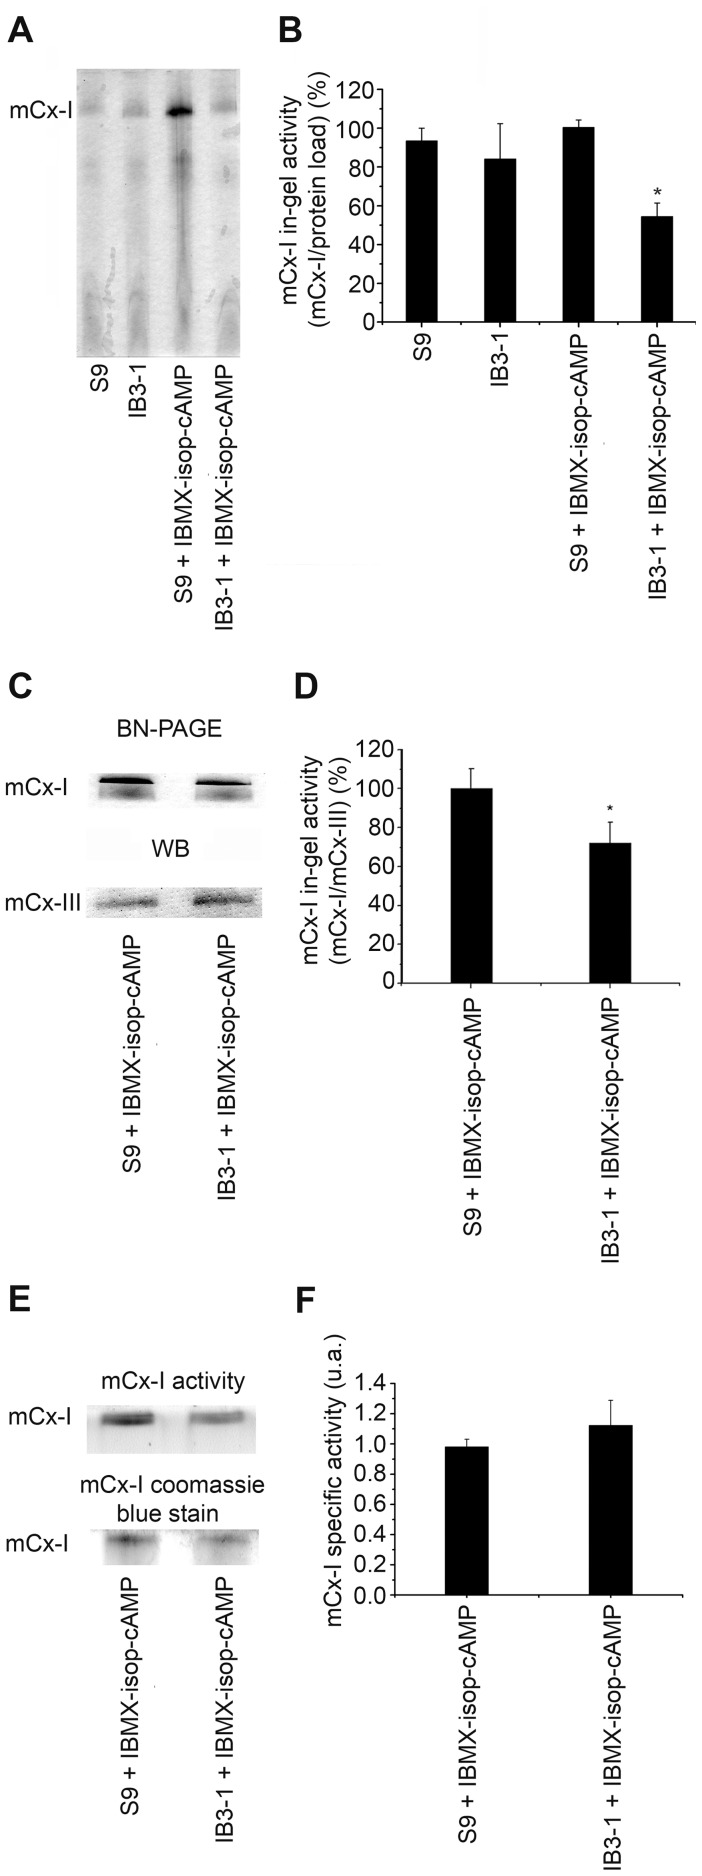
Figure 2. Mitochondrial complex I in-gel activity (IGA) of IB3-1 and S9 cells.
A: IGA of mitochondrial extracts from Control and CFTR-stimulated IB3-1 and S9 cells (IBMX-isop-cAMP), adding 200 µM cAMP, 10 µM isoproterenol, 200 µM IBMX, for 24 h. B: Densitometric quantification and statistical analysis of the results shown in panel A. IGA was calculated as indicated in Figure 1. Measurements were performed in duplicate and data are expressed as mean ± SE of five independent experiments (n = 5). * indicates p<0.05, as compared with S9 stimulated cells. C: IGA of mCx-I and mCx-III (UQCRC1) expression measured by using Western blots from S9 and IB3-1 cells (both after CFTR stimulation). D: Densitometric quantification and statistical analysis of the results shown in panel C. IGA of mCx-I was calculated as the ratio mCx-I IGA/UQCRC1. Measurements were performed in duplicate and data are expressed as mean ± SE of two independent experiments (n = 2). * indicates p<0.05, as compared with S9 stimulated cells. E: IGA of the mCx-I and Coomassie blue stain from a BN-PAGE using mitochondrial extracts from S9 and IB3-1 cells. F: Specific activity of the results shown in panel E, calculated as the ratio mCx-I IGA/mCx-I coomassie blue stain. The mCx-I specific activity is expressed in arbitrary units (a.u.) as mean ± SE (n = 3). The specific activity of CF cells (IB3-1) and CF corrected cells (S9) showed similar values, without significant differences (p>0.05).

