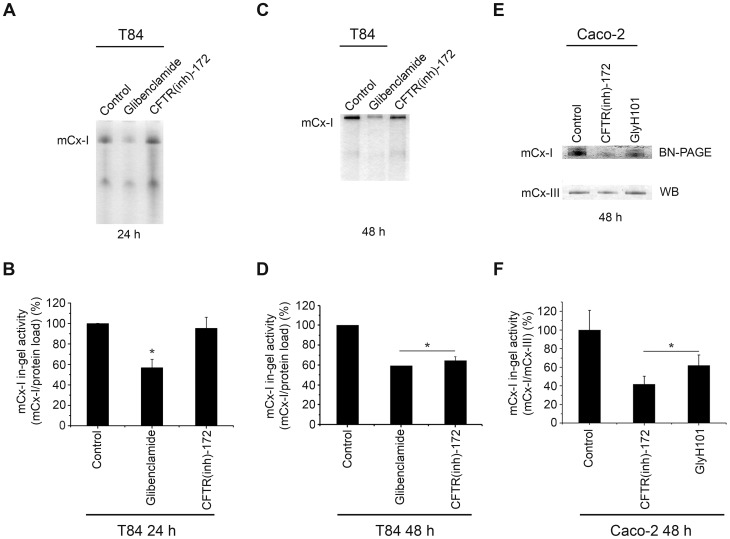
Figure 3. Mitochondrial complex I in-gel activity (IGA) measured in cells expressing wt-CFTR.
A: IGA of mitochondrial extracts from T84 cells after 24 h of treatment with 100 µM glibenclamide or 5 µM CFTR(inh)-172. B: Densitometric quantification of the results shown in panel A, expressed as % ratio of (mCx-I activity)/(protein load). C: IGA of mitochondrial extracts from T84 cells after 48 h of treatment with 100 µM glibenclamide or 5 µM CFTR(inh)-172. D: Densitometric queantification of C. E: IGA of the mCx-I from Caco-2 cells after 48 h of treatment with 5 µM GlyH101 or 5 µM CFTR(inh)-172, and WB of the mCx-III subunit UQCRC1, as internal standard. F: Densitometric quantification of the results shown in E expressed as % ratio of (mCx-I IGA)/UQCRC1(a.u.). The activity of mCx-I in T84 and Caco-2 cells treated with the same amount of DMSO (0.1%) was considered as 100%. Measurements in T84 cells were performed in duplicate and data are expressed as mean ± SE of three independent experiments (n = 3). Caco-2 cells results were obtained in triplicate and expressed as mean ± SE of three independent experiments (n = 3). * indicates p<0.05, as compared with control cells (ANOVA and Turkey's test).

