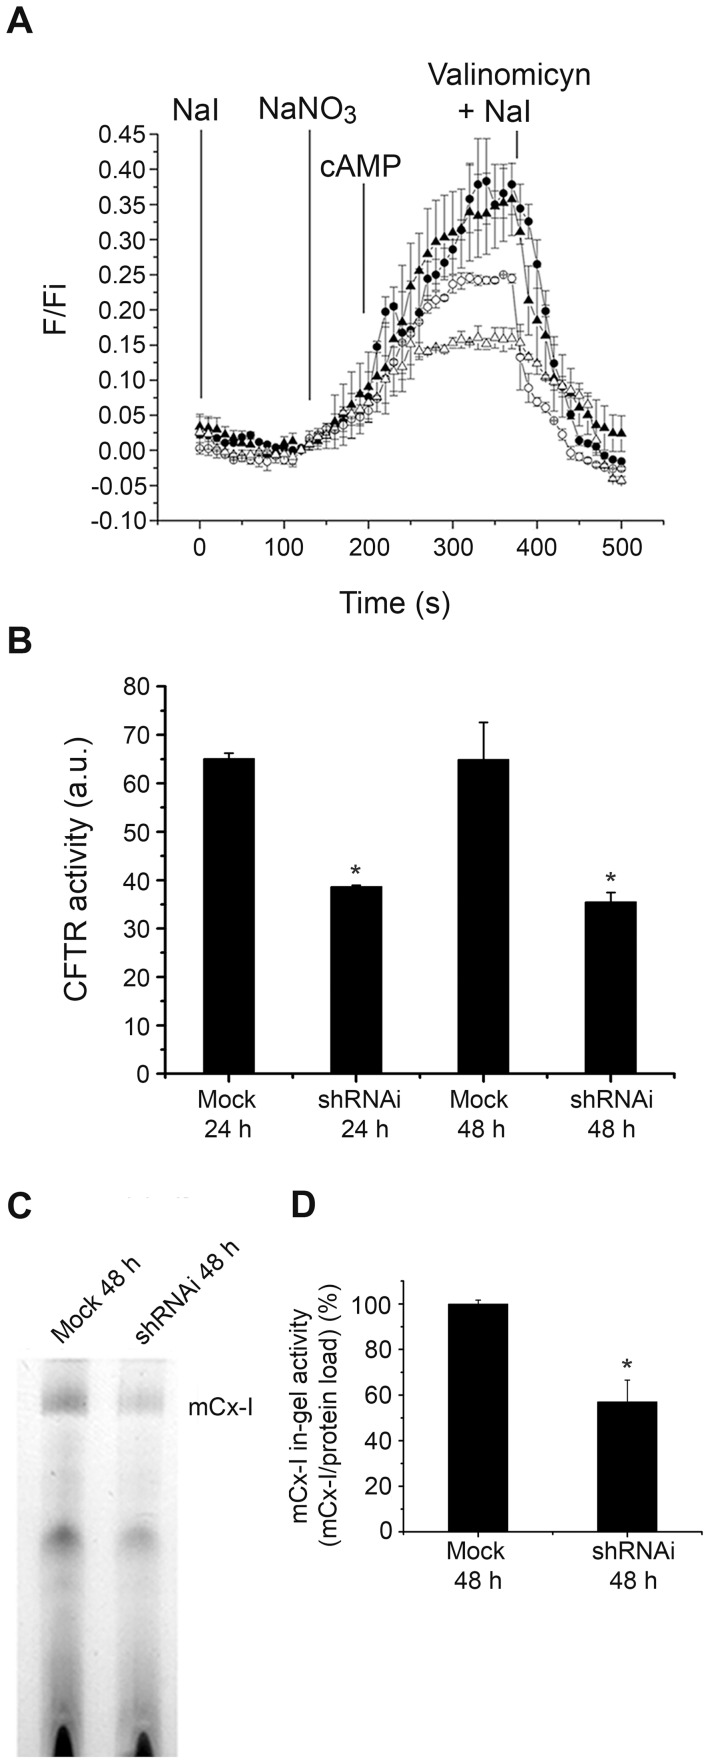
Figure 4. Effects of CFTR-shRNAi in T84 cells on the mitochondrial complex I in-gel activity (IGA).
The figure shows the CFTR channel transport activity of T84 cells transiently transfected with a shRNAi plasmid against CFTR and its effects on the IGA of mCx-I. A: T84 cells were transfected with empty plasmids (as control, mock-transfected cells) and shRNAi plasmids, to transiently knock down CFTR. Transfected cells were loaded overnight with 5 mM SPQ (Cl− fluorescent probe) to measure CFTR chloride transport activity. The CFTR activity was measured 24 h (shRNAi: -○-, mock: -•-) and 48 h (shRNAi: -Δ-, mock: -▴-) post electroporation. NaI, indicates perfusion with buffer NaI to quench the SPQ fluorescence at the beginning of the experiment. NaNO3, indicates the addition of the NaNO3 buffer to measure the basal activity of the CFTR. cAMP, indicates stimulation of the CFTR activity by adding 200 µM cAMP, 10 µM isoproterenol, 200 µM IBMX in NaNO3 buffer. NaI plus Valinomicyn, indicates the addition of quenching buffer. F, indicates fluorescence values; Fi, are initial fluorescence values just before adding the NaNO3 buffer. B: To analyze the CFTR activity changes observed in panel A, the halide efflux was expressed as the area under the curve (integration), expressed as arbitrary units (a.u.). Mock: T84 cells transfected with the empty plasmid as control; shRNAi: T84 cells transfected with the shRNAi plasmid, (24 h and 48 h post transfection). Data are expressed as mean ± SE of two independent experiments (n = 2). * indicates p<0.05 as compared with mock-transfected cells. C: IGA of the mCx-I from mitochondrial extracts corresponding to T84 cells transfected with CFTR-specific shRNAi or empty pSilencer plasmids (Mock). Measurement was performed 48 h post transfection. D: Densitometric quantification and statistical analysis of the results shown in panel C indicated as the ratio (mCx-I activity)/(protein load). Measurements were performed in duplicate and data are expressed as mean ± SE of four independent experiments (n = 4). * indicates p<0.05, as compared with mock-transfected cells (ANOVA and Turkey's test).

