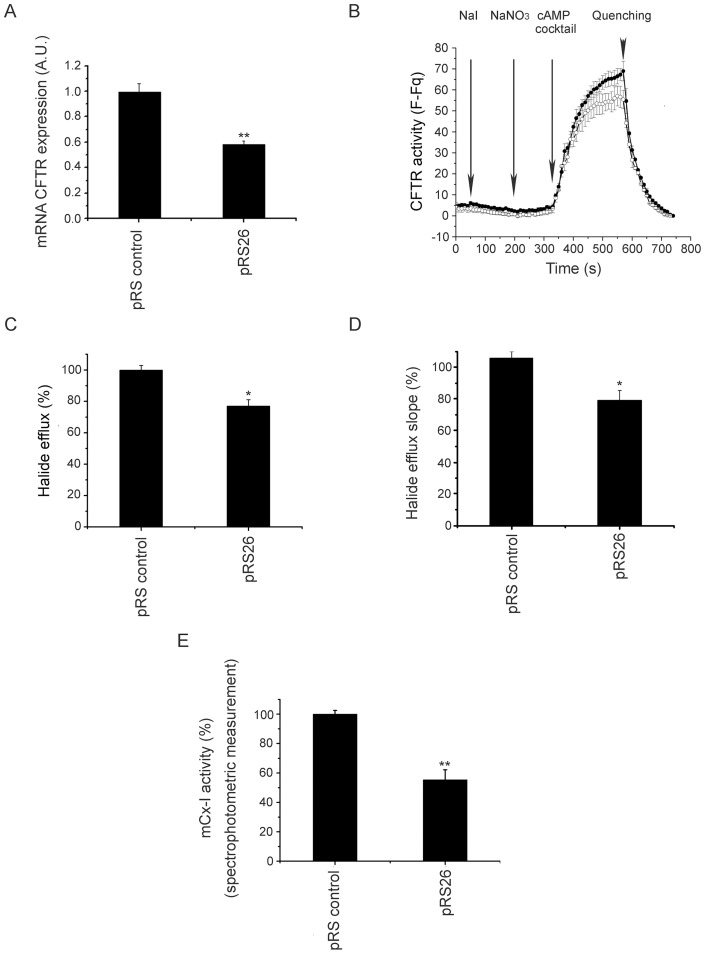
Figure 5. Stable CFTR knock down and mCx-I activity.
A: CFTR mRNA expression levels in Caco-2/control cells (transfected with pRS control) and Caco-2/pRS26 cells (transfected with the shRNAi pRS26) determined by quantitative real-time RT-PCR. The results were expressed in arbitrary units (a.u.). Measurements were performed in five independent experiments (n = 5) each done in duplicate. B: CFTR channel halide transport activity of pRS control (-•-) and pRS26 cells (-○-). Arrows indicate the points of buffers addition. F, indicates fluorescence values; Fq, are the fluorescence values after SPQ quenching by adding NaI plus valinomicyn buffer (at 750 s). The graph is representative of three independent experiments (n = 3), each done in duplicate. Changes in the halide efflux between pRS control and pRS26 cells, where represented as the areas under the curve (total halide efflux, panel C) and also as the halide efflux slopes (slope of the first 10 points after cAMP stimulation, adjusted by linear regression) (halide efflux rate, panel D). C and D data were plotted as percentage (%) relative to controls. E: Spectrophotometric measurement of the mCx-I activity in CFTR knock down cells compared to control cells, expressed as percentage (%) relative to control values. The cells were incubated 24 h in serum free medium before the experiments. All data were expressed as mean ± SE. ** indicates p<0.001 and *p<0.05, as compared with control cells. Statistical analyses were performed by ANOVA and Turkey's test.

