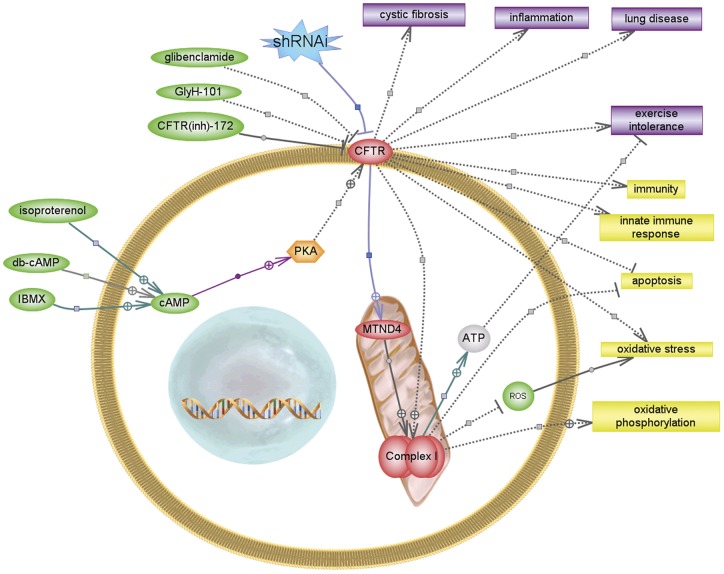
Figure 6. CFTR modulation and reduced mCx-I activity.
The graphic illustrates the results obtained and possible effects of a reduced activity of mCx-I, according to know relationships extracted from published work by using the Pathway Studio Software (Ariadne Genomics). Small molecules are indicated in green, proteins in red-orange, cellular processes in yellow and diseases in violet. Some relationships found by the program through its curated database were deleted or fused to simplify the illustration and few were added manually using data extracted from PubMed by using the program subroutines (the last relationships shown as solid lines).

