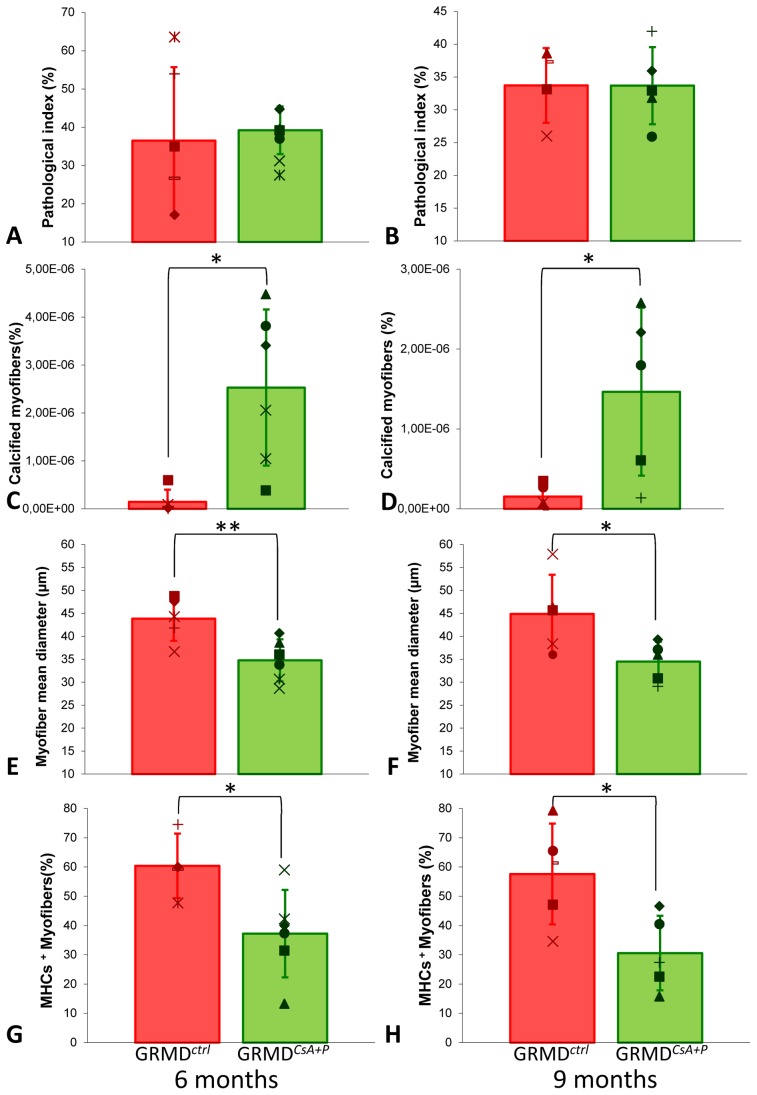
Figure 2. Main histological findings.
This panel of graphs provides the main histological results arising from the quantitative analysis of the muscle biopsies. The mean ± SD of the obtained values are represented by histograms and error-bars, and because of the low number of biopsies analyzed, individual values are superimposed to the histograms. The results obtained in GRMDctrl dogs are in red on the left of the graphs, and the results obtained in GRMDCsA+P are in green, on the right of the graphs. As biopsies were sampled at two points during the treatment, the values obtained at 6 months are represented in the left-hand graphs and the values at 9 months by the right-hand graphs. The pathological index was not significantly modified in the treated dogs, either at 6 months (A), or at 9 months (B). The amount of calcified myofibers was increased in treated dogs biopsies, at 6 (C) and 9 (D) months. The mean myofiber diameter was lower in treated dogs at 6 (E) and 9 (F) months. Finally, the biopsies originating from treated dogs contained significantly less slow-type fibers at 6 (G) and 9 (H) months. * means that p<0.05 ; ** means that p<0.01.

