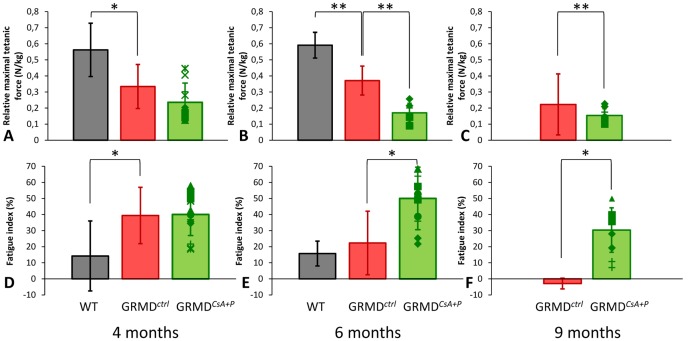
Figure 3. Main results of the in vivo force measurement.
The results of relative maximal tetanic force (top graphs: A to C) and of the fatigue index (bottom graphs: D to F) are graphically represented at 4 months (on the left: A and D), 6 months (in the middle: B and E), and 9 months (on the right: C and F). The results obtained in the treated dogs (green) are compared with the ones obtained in the untreated GRMD dogs (red) and the healthy dogs (gray). The height of the histograms represent the mean value in the considered population, and the error-bar the SD. Right- and left-leg GRMDCsA+P values are represented by superimposed points. The treated dogs had a significantly lower tetanic force at 6 (B) and 9 months (C), and an increased fatigue at 6 (E) and 9 months (F). Significant differences are represented by * if p<0.05 and by ** if p<0.01.

