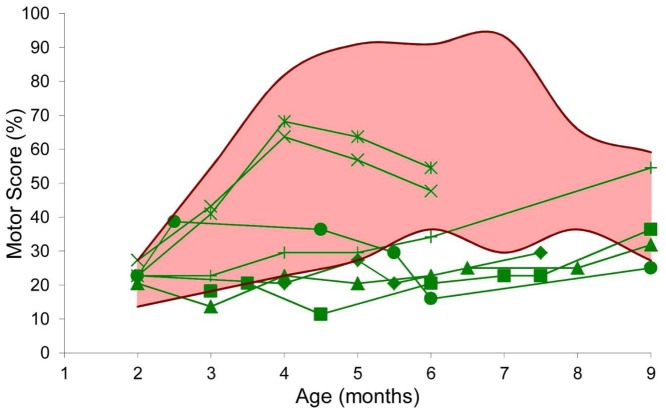
Figure 5. Evolution of the motor score during the treatment.
This graph represents the longitudinal evolution of the motor score of the treated dogs (green, individual symbols provided in table 1), in comparison with the range (pink area) of values (dark red curves = min and max) obtained in a population of 24 untreated GRMD dogs, during the treatment period (2 to 9 months). Two features are uncommon and therefore noticeable: firstly the break in the curve of “Clim” [×] and “Clappy” [ ], and secondly the unusually low values of the motor scores obtained in the 5 other treated dogs. The motor score were significantly improved in the treated dogs between 5 and 9 months.

