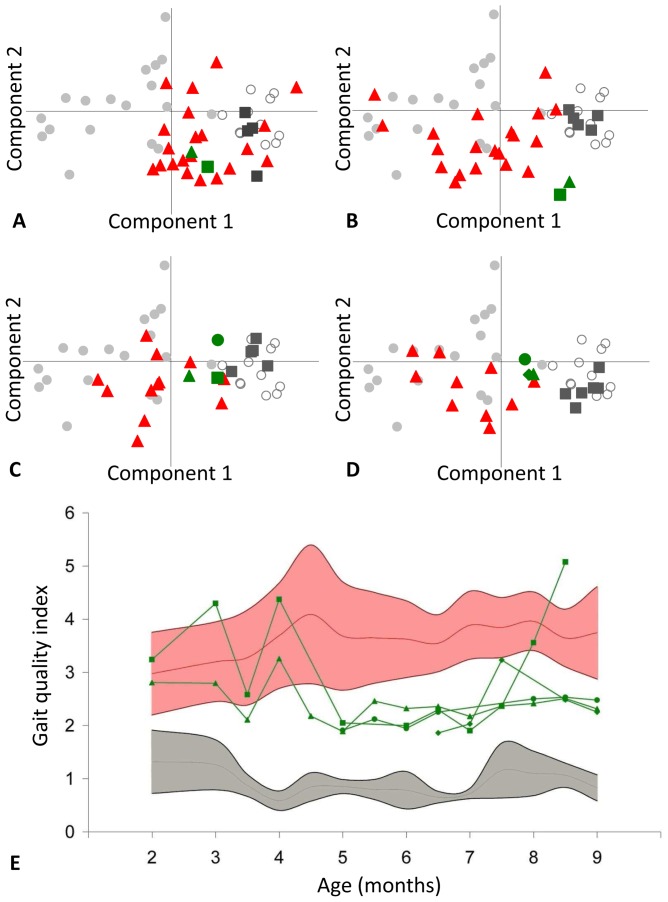
Figure 6. Gait evaluation during the treatment: global analysis by the study of the dog's course on the reference PCA plane quantified by the gait quality index.
Position of the treated dogs (green own symbols) on the reference PCA plane defined by 18 adult GRMD dogs (grey circles) and 11 adult healthy dogs (empty circles), at 2 (A), 4 (B), 6 (C) and 9 (D) months. The age-matched untreated GRMD dogs are represented by red triangles and the age-matched healthy dogs by dark grey squares. The PCA was performed using 7 variables (stride frequency, stride length, total power, 3 relative axial powers, regularity), and the 2D-representation of the PCA induces a very low information loss, because it represents 90.58% of the variance (component 1: 68.17%, component 2: 22.41%). It is remarkable that the treated GRMD dogs, initially matched in position with untreated GRMD dogs, progressively move towards an intermediary position between GRMD and healthy dogs. This is quantitatively supported by the evolution of the gait quality index (graph E). The individual evolutions in treated dogs (green curves) are compared to the mean (red curve) ± SD (pink area) of untreated GRMD dogs and the mean (grey line) ± SD (grey area) of healthy dogs, in function of the age. The gait quality index is, from the age of 5 months in treated dogs, within intermediary values between untreated GRMD and healthy dogs. The position of the treated dogs is significantly nearer from the healthy center of gravity between 5 and 9 months.

