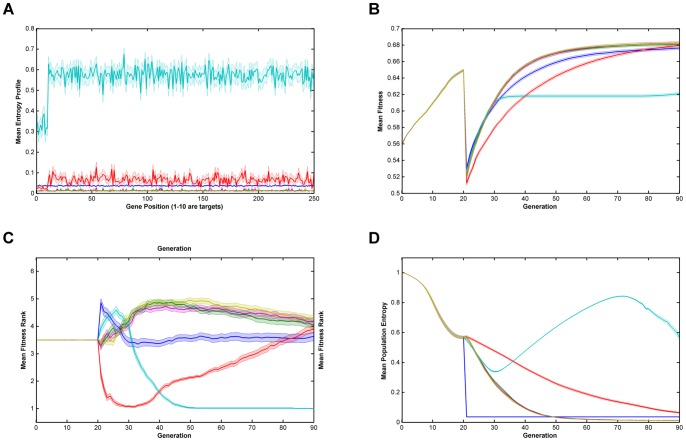
Figure 4. Relative performance of the six algorithms on the modified NK-landscapes where λ = 1000, N = 250, K = 5, r = 10 & burn-in = 20.
Note that there a discontinuity in fitness where the algorithm switches from ‘global fitness’, F, to trait fitness, F'. Key: A. Mean Entropy Profile at Final Generation; B. Mean Fitness; C. Mean Fitness Rank; D. Mean Entropy; —— Breeder; —— Standard GA; —— Local Mating; —— Niching; —— EARL1; EARL2; Error bands are ±1 standard error = ± stdev/√n.

