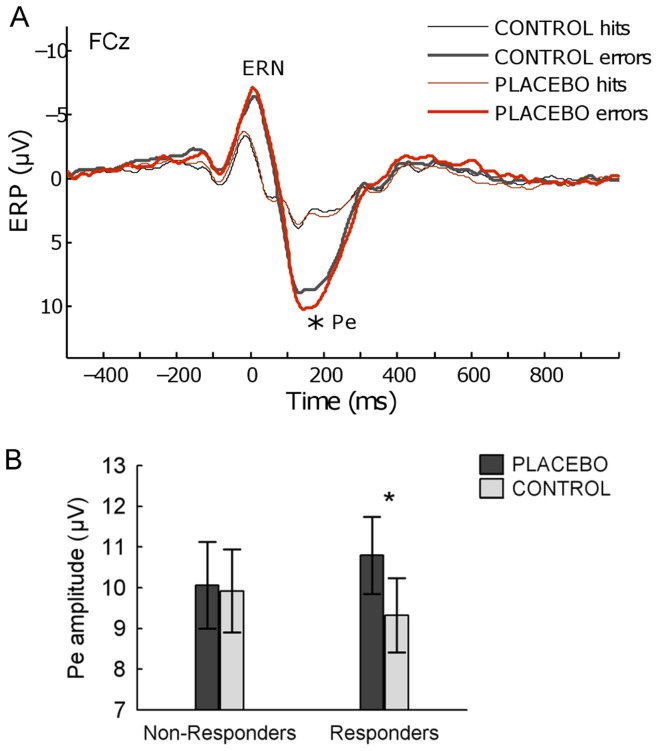
Figure 3. Grand average ERPs for errors and correct hits in placebo and control conditions at electrode FCz.
(A). Pe amplitudes (mean across Fz, FCz, and Cz) for placebo responders and non-responders separately, for placebo and control sessions. Only placebo-responders showed an increased Pe response to errors in the placebo condition (B). Vertical bars denote standard errors.

