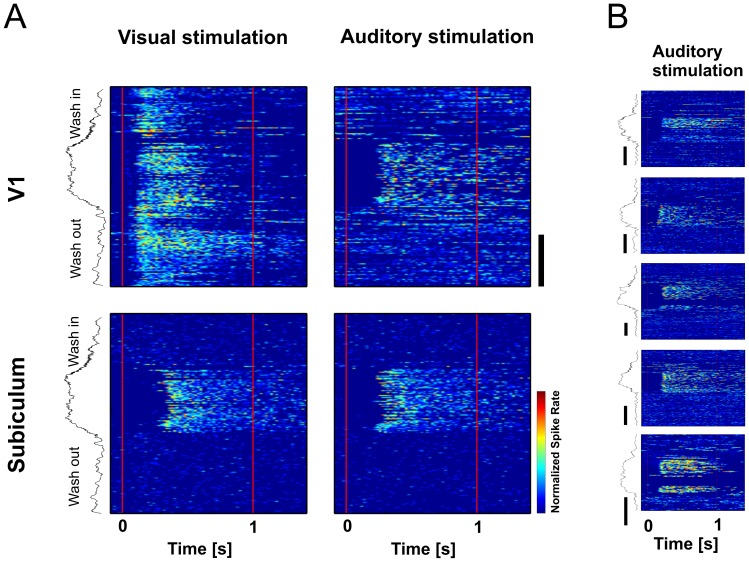
Figure 7. Discontinuous change in excitability in V1 and the subiculum between light and deep anesthesia.
(A) Single trial responses of multi units to visual (left) and auditory (right) stimulation during one cycle of isoflurane wash-in and wash-out. Color-coded plots show responses in V1 (top row) and subiculum (bottom row). Red lines indicate stimulus onset and offset. Trials are ordered from top to bottom. Corresponding CSR (black trace) is plotted on the left side. Trials were separated by 10s interstimulus intervals. (B) Examples of auditory evoked responses in V1 during deep anesthesia from five different mice. Color coded plots show multi unit responses in V1 of one cycle of isoflurane wash-in and wash-out corresponding to right upper panel in (A). Time bars indicate 10min.

