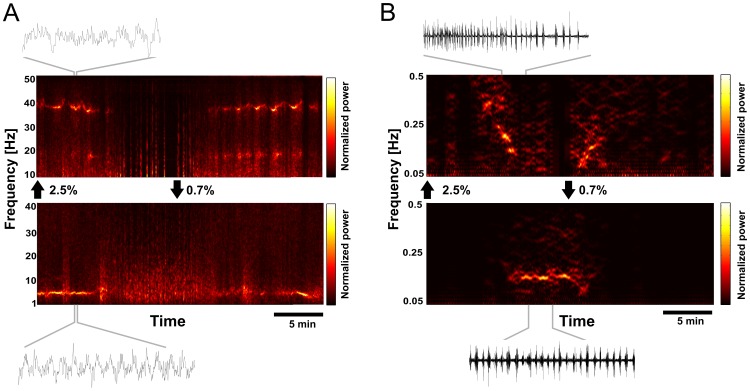
Figure 8. Time-frequency analysis of ongoing LFP activity.
(A) Time-frequency plots of LFP activity in V1 (upper panel) and subiculum (lower panel) during wash-in/wash-out cycle. Black arrows between panels depict the onset of wash-in and wash-out. Note that frequencies are shown only from 10–50 Hz for V1, and frequencies from 1–40 Hz for the subiculum. Examples of raw signals (3s interval) are shown above and below the panels. (B) Time-frequency plots for V1 (upper panel) and subiculum (lower panel) for frequency range below 0.5 Hz. Note that different to (A) in (B) the time-frequency analysis was applied to the envelope of the LFP signal in order to analyze the presence and frequency of recurring burst events (see methods). Examples of raw signal (140s interval) are shown above and below the panels.

