Fig. 2.

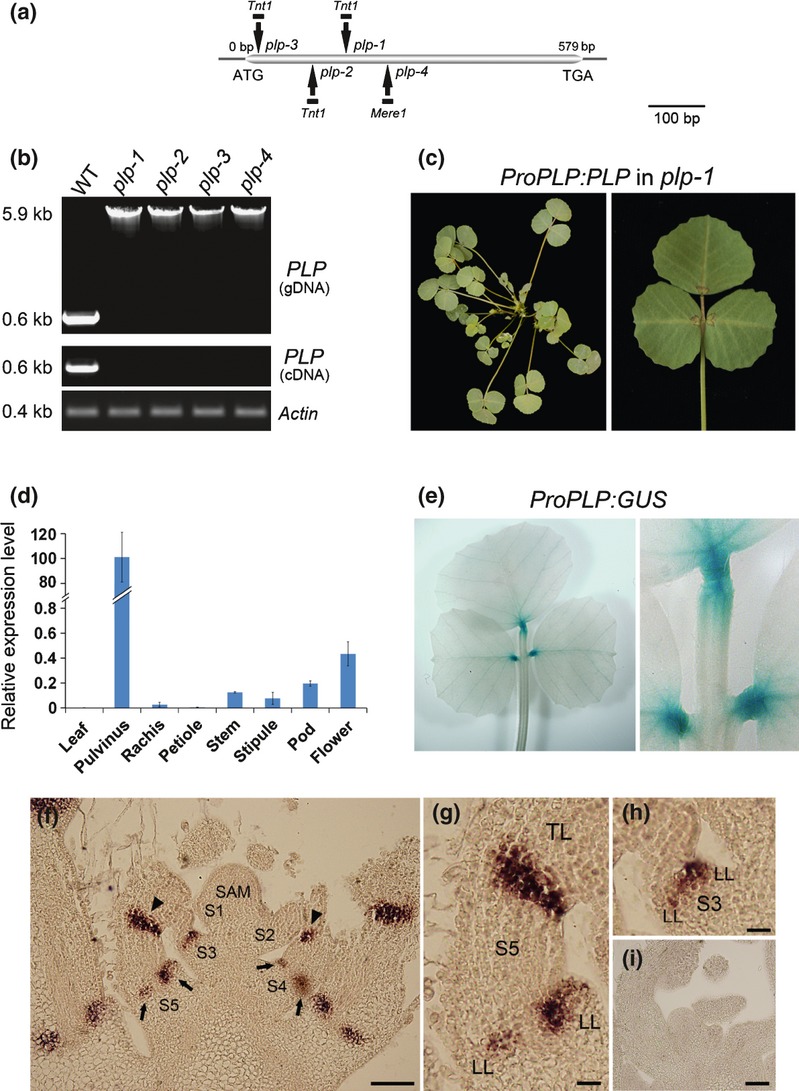
Molecular cloning and expression pattern of PLP in Medicago truncatula. (a) Schematic representation of the gene structure of PLP. The positions of ATG start and TGA stop codons are shown. Vertical arrows mark the location of Tnt1 or Mere1 retrotransposons in plp alleles. (b) PCR and RT-PCR amplification of PLP from the wild-type (WT) and plp mutants. A single insertion (c. 5.3 kb) was detected in each mutant line. PLP expression was not detected in the mutants. Actin was used as a loading control. Three technical replicates were performed. (c) Genetic complementation of the plp mutant. A representative plp-1 line transformed with the PLP genomic sequence (ProPLP : PLP) showed normal wild-type-like leaves and pulvini. (d) Quantitative reverse transcription-polymerase chain reaction (qRT-PCR) analysis of the expression pattern of PLP. Values are means ± SD (n = 3). (e) β-Glucuronidase (GUS) staining of trifoliates of transgenic M. truncatula plants carrying the PLP Promoter-GUS construct. (f–i) In situ hybridization analysis of PLP mRNA in vegetative apices of the wild type. Longitudinal section of the shoot apical meristem (SAM) is shown in (f). Arrows point to lateral leaflet base. Arrowheads point to terminal leaflet base. The close-up views of S5 and S3 are shown in (g) and (h), respectively. (i) In situ hybridization using the sense probe as control. S1–S5, stage1 to stage5; TL, terminal leaflet primordia; LL, lateral leaflet primordia. Bars, (f,i) 50 μm; (g,h) 10 μm.
