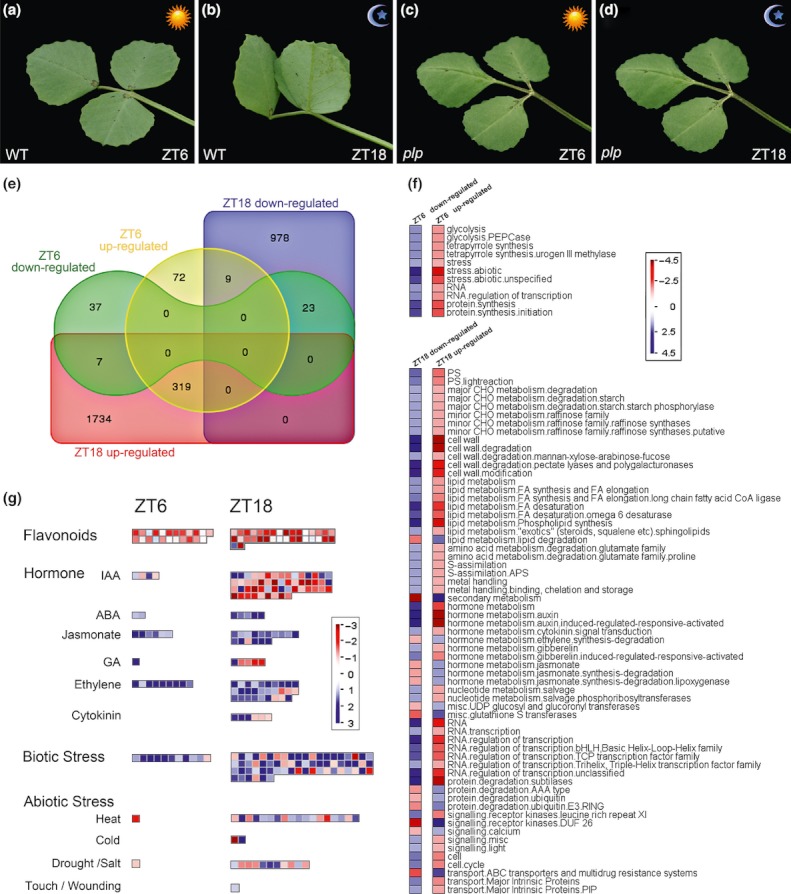
Fig. 4.

Leaf movement and differential expression of metabolic genes in Medicago truncatula wild-type and plp mutant leaves at ZT6 (noon) and ZT18 (midnight). (a,b) Leaf movement of wild type (WT) at ZT6 and ZT18. (c,d) The plp mutant lost its usual dynamic movement of leaflets because of the altered structure of pulvinus. (e) Venn diagram (http://bioinformatics.psb.ugent.be/webtools/Venn/) of total numbers of upregulated and downregulated genes in the plp mutant at ZT6 and ZT18. (f) PageMan functional enrichments of differentially expressed genes. Red, underrepresented functional categories; blue, overrepresented functional categories; (g) Selected significantly differentially expressed genes in flavonoids and hormone metabolism, as well as in biotic and abiotic stress. Visualization of these genes with MapMan 3.5.1R2 using log2-transformed ratios of the mutant divided by wild-type. Red, up-regulated genes; blue, down-regulated genes.
