Figure 3.
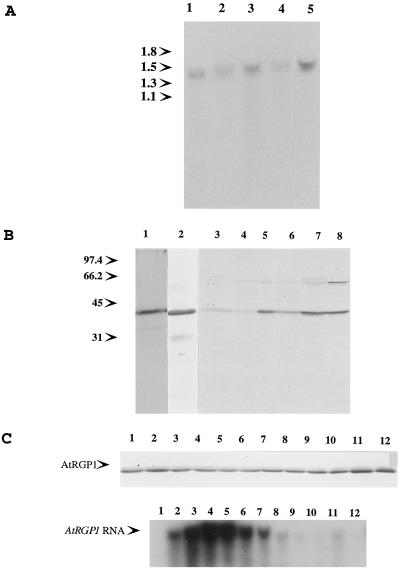
AtRGP1 RNA and protein are highest in suspension-cultured cells and roots from whole plants. A, RNA levels in different tissues. Total RNA (30 μg) from A. thaliana flowers (lane 1), leaves (lane 2), roots (lane 3), stems (lane 4), and suspension-cultured cells (lane 5) was separated in a 1% agarose and 6% formaldehyde gel, transferred onto a nylon membrane, and hybridized with a random-primed, 32P-labeled, 1.0-kb EcoRI-BbvI fragment of the AtRGP1 cDNA. The single band obtained is of the expected size. Molecular mass is indicated in kilodaltons. B, Protein levels in different tissues. Immunoprecipitations using total protein from [35S]Met-labeled protoplasts (lane 1) and unlabeled protoplasts (lane 2) were performed. The former was analyzed by SDS-PAGE and autoradiography and the latter was analyzed by immunoblot. Total protein (50 μg) from A. thaliana flowers (lane 3), leaves (lane 4), roots (lane 5), stems (lane 6), root liquid culture (lane 7), and cell-suspension cultures (lane 8) was analyzed by immunoblotting using anti-AtRGP1 antibodies. Molecular mass is indicated in kilodaltons. C, AtRGP1 RNA and protein levels during the growth cycle of suspension cells. A cell-suspension culture was started by diluting a 1-week-old culture 10 times with fresh medium. Samples representing 1/40 of the original volume were collected at 1-d intervals, and protein and RNA were extracted from each sample. Top, Total AtRGP1 protein from each sample was analyzed by immunoblot; bottom, total AtRGP1 RNA was determined as described in Figure 4A.

