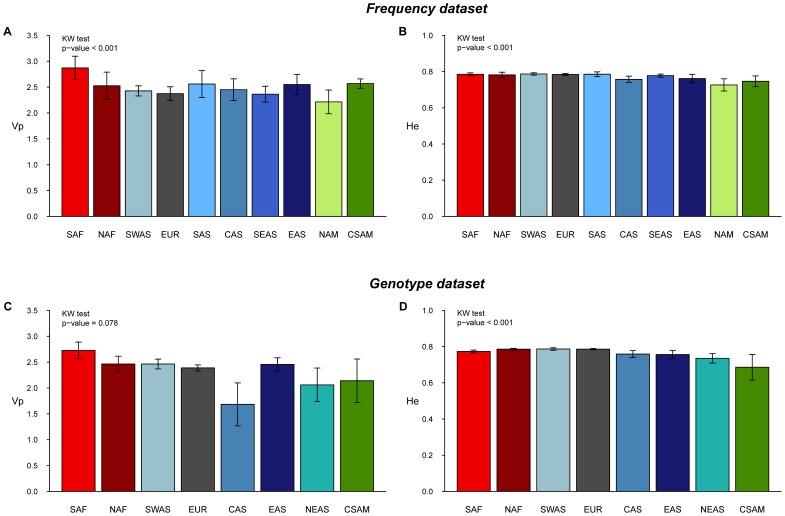
Figure 2. Average genetic diversity (and standard deviation) over populations in geographic groups.
10 groups for the Frequency dataset and 8 for the Genotype dataset (see text). A and C graphs show the distribution of the variance in allele sizes (Vp) for the Frequency and Genotype datasets, respectively. B and D graphs show the distribution of the expected heterozygosity (He) for the Frequency and Genotype datasets, respectively. P-values for the Kruskal-Wallis test (test of significant differences among all groups).

