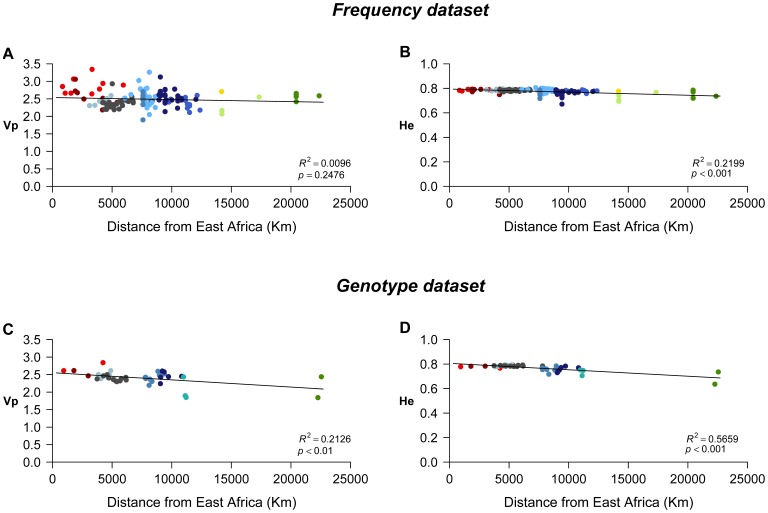
Figure 3. Plots of population diversity against geographic distance to East Africa (Addis Ababa).
A: Vp against geographic distance for the Frequency dataset; B: He against geographic distance for the Frequency dataset; C: Vp against geographic distance for the Genotype dataset; D: He against geographic distance for the Genotype dataset. The determination coefficient (R2) estimates the proportion of the variation in genetic diversity that is explained by the variation in geographic distance to East Africa.

