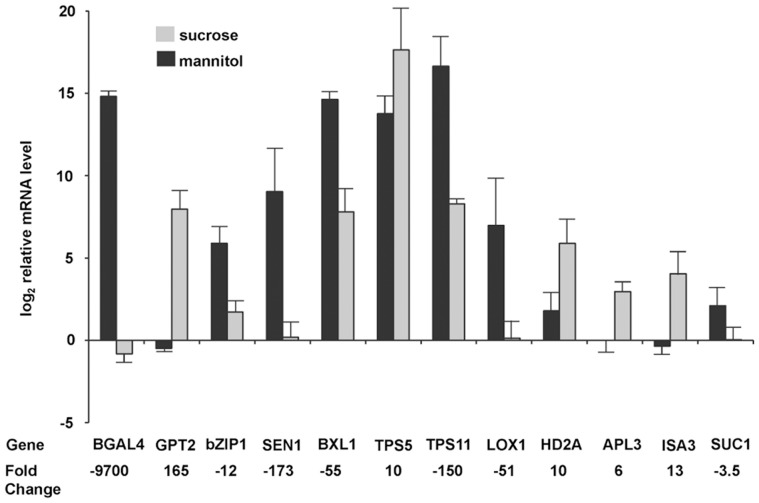
Figure 4. Real-time PCR data for selected genes whose expression responded to sucrose.
The data are averaged values for four biological replicate samples (± se) for RNAs of guard cells isolated from leaves treated with either sucrose or mannitol. The data are normalized to the expression of the CCH1 gene (At5g13630), which is expressed at high levels in guard cells and does not respond to sucrose. Fold changes were calculated from the difference in the log2 relative mRNA level (determined by real-time PCR, not by microarray) for sucrose versus mannitol treated samples. Positive fold changes indicate genes that were up-regulated in sucrose.

