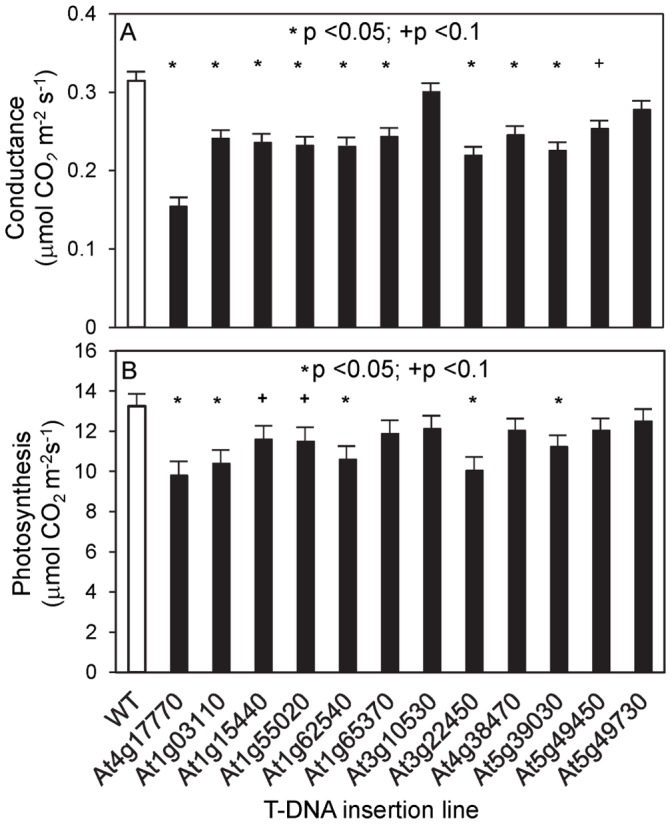
Figure 5. Stomatal conductance of selected T-DNA insertion mutants.

Steady-state leaf stomatal conductance (A) and photosynthesis (B) measured under ambient conditions at 24°C, 390 ppm CO2, relative humidity 65–70%. The data are averaged values (± se) for 4 to 5 plants for each genotype. The T-DNA insertion lines tested were SALK 144791 or tps5-1 (At4g17770), SALK 025857 (At1g03110), SALK 037412 (At1g15440), SALK 012188 (At1g55020), SALK 098896 (At1g62540), SALK 104078 (At1g65370), SALK 057632 (At3g10530), SALK 081267 (At3g22450), SALK 112195 (At4g38470), SALK 007613 (At5g39030), SALK 059343 (At5g49450), and SALK 099597 (At5g49730). WT, wild type; * p<0.05;+p<0.1.
