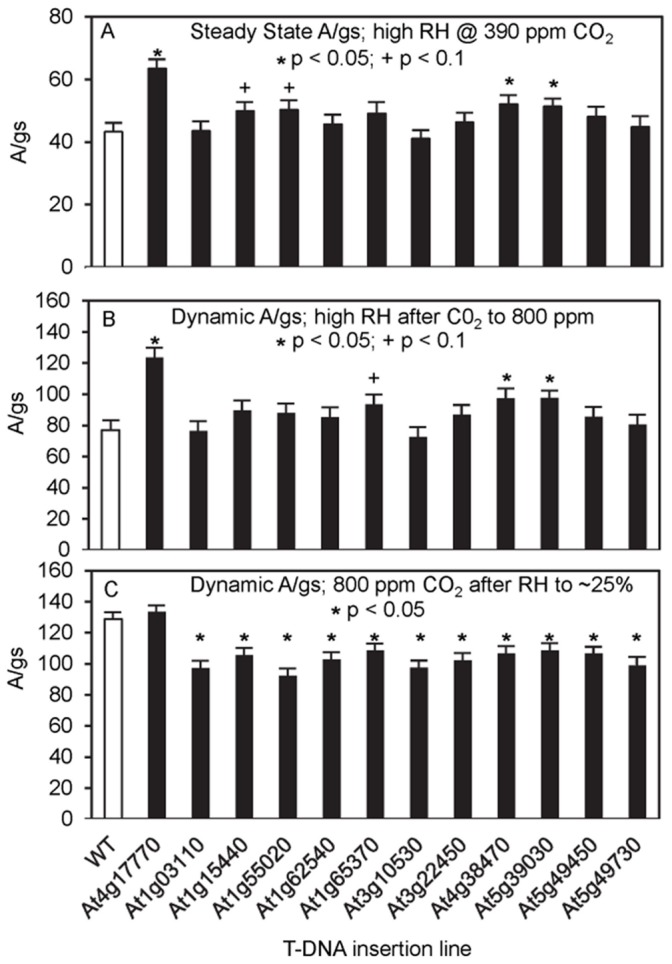
Figure 6. Water-use efficiency of T-DNA insertion mutants.

Instantaneous water-use efficiency, the ratio of photosynthesis to conductance (A/gs) at 65–70% relative humidity and 390 ppm CO2 (A) after a rapid increase of [CO2] to 800 ppm (B) and after a rapid decrease in relative humidity to 25% (C). The data are averaged values (± se) for 4 to 5 plants for each genotype. The T-DNA insertion lines tested are as in Figure 5. WT, wild type; * p<0.05;+p<0.1.
