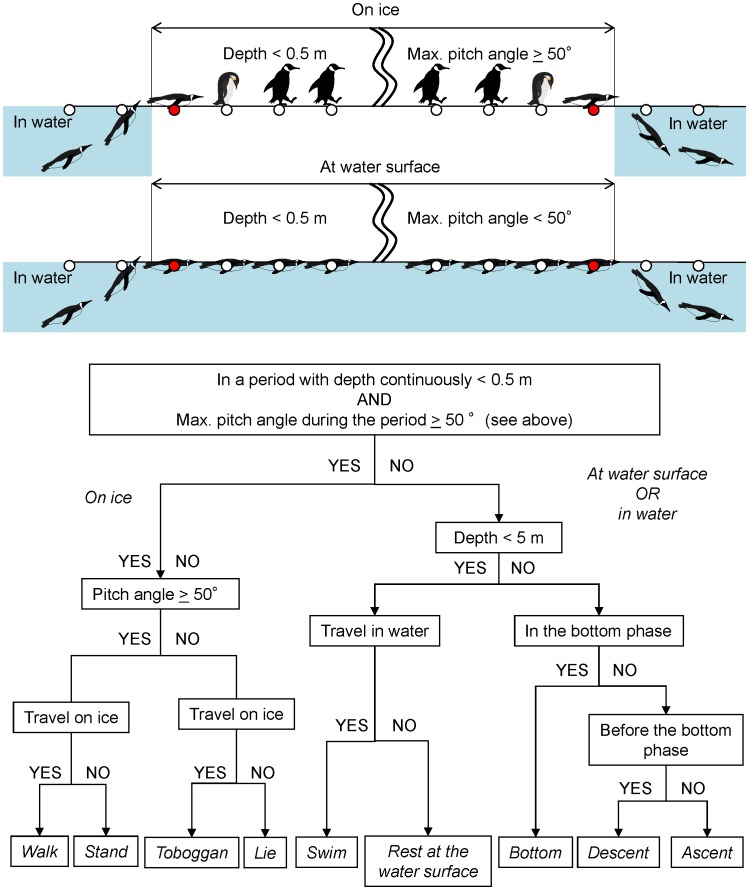
Figure 6. A flowsheet to categorize nine activity types of emperor penguins by time (lower) and a diagram of the first step in the procedures (upper), using depth data and two components of acceleration data along with the longitudinal axis of the body recorded by a logger.
Pitch angle was estimated from the low-frequency component less than 0.5 Hz and traveling activity estimated from high-frequency component in the k-means cluster analysis.

