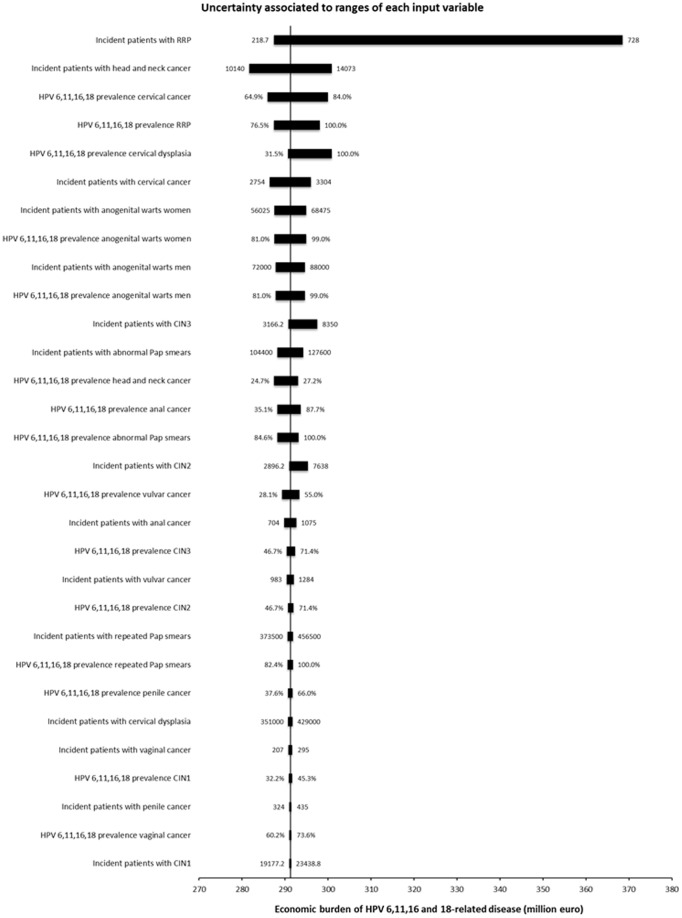
Figure 3. Sensitivity analysis.
The Tornado chart reported in Figure 3 shows the changes in our valuation of the economic burden of HPV 6,11,16 and 18-related disease associated with ranges of values for each input variable. Uncertainty is mostly is associated with the widest swing in the incidence rate of RRP patients per year.

