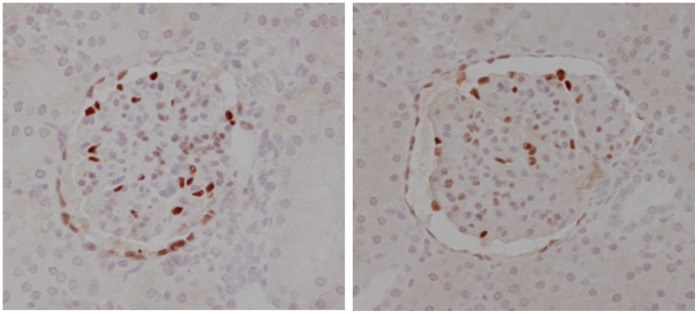
Figure 4. Podocytes in glomerular tuft cross section.
Representative pictures WT-1 stained glomerular tuft cross sections of a normal kidney (left) compared to a solitary kidney (right). The pictures demonstrate an overview of the ratio of podocytes (red) versus the number of other glomerular cells (blue, original magnification 200x).

