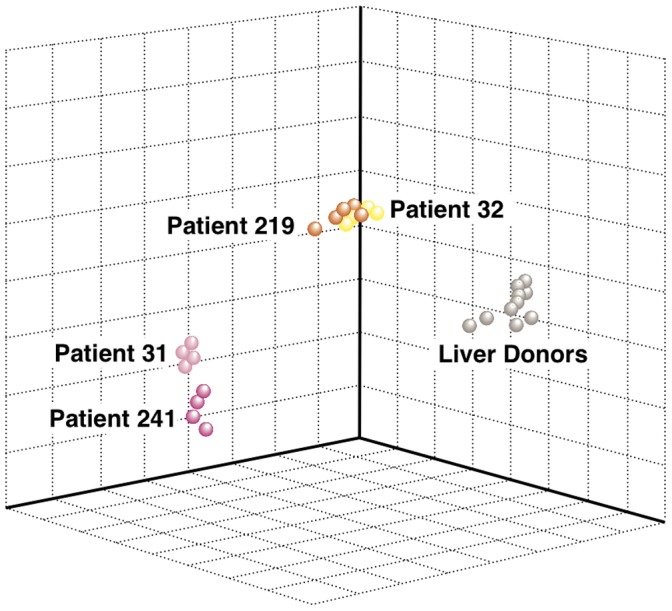
Figure 3. Multidimensional scaling.

Three-dimensional (3D) projection of 17 liver specimens from 4 patients with ALF and 10 specimens from individual liver donors by multidimensional scaling using all 11,597 transcripts that passed the filtering criteria. In the 3D projection, each point represents an individual liver specimen, and the distance between points is proportional to the overall dissimilarity of gene expression profiling. The plot illustrates how the gene expression profiles differentiate between ALF and liver donors, as well as among ALF patients. ALF patients with massive hepatic necrosis (MHN) (Patients 241 and 31) and those with submassive hepatic necrosis (SHN) (Patients 219 and 32) form two distinct clusters whose distance from liver donors reflects the extent of liver injury.
