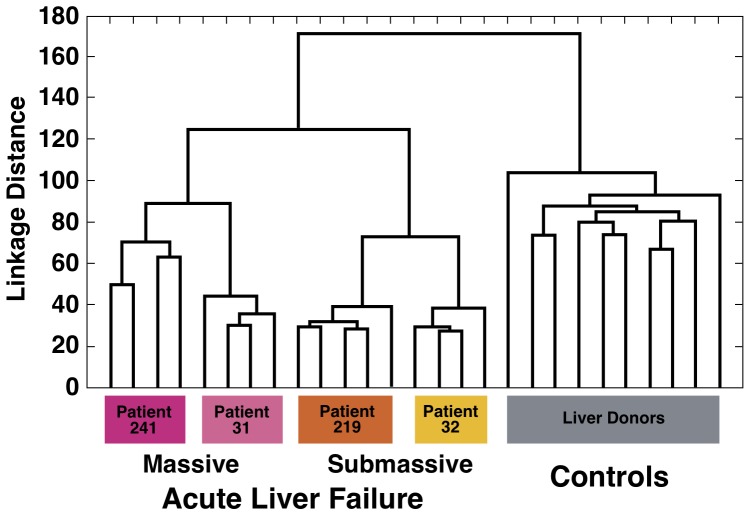
Figure 4. Hierarchical clustering.
Hierarchical cluster analysis of 17 liver specimens from 4 patients with acute liver failure and 10 specimens from individual liver donors using all 11,597 transcripts that passed the filtering criteria. All specimens were grouped into 3 main clusters, which correspond to the 3 liver conditions (ALF with MHN, ALF with SHN and liver donors). The unsupervised nature of the analysis and the 100% correct classification of samples suggest a high specificity and sensitivity of gene expression differences between ALF and normal livers.

