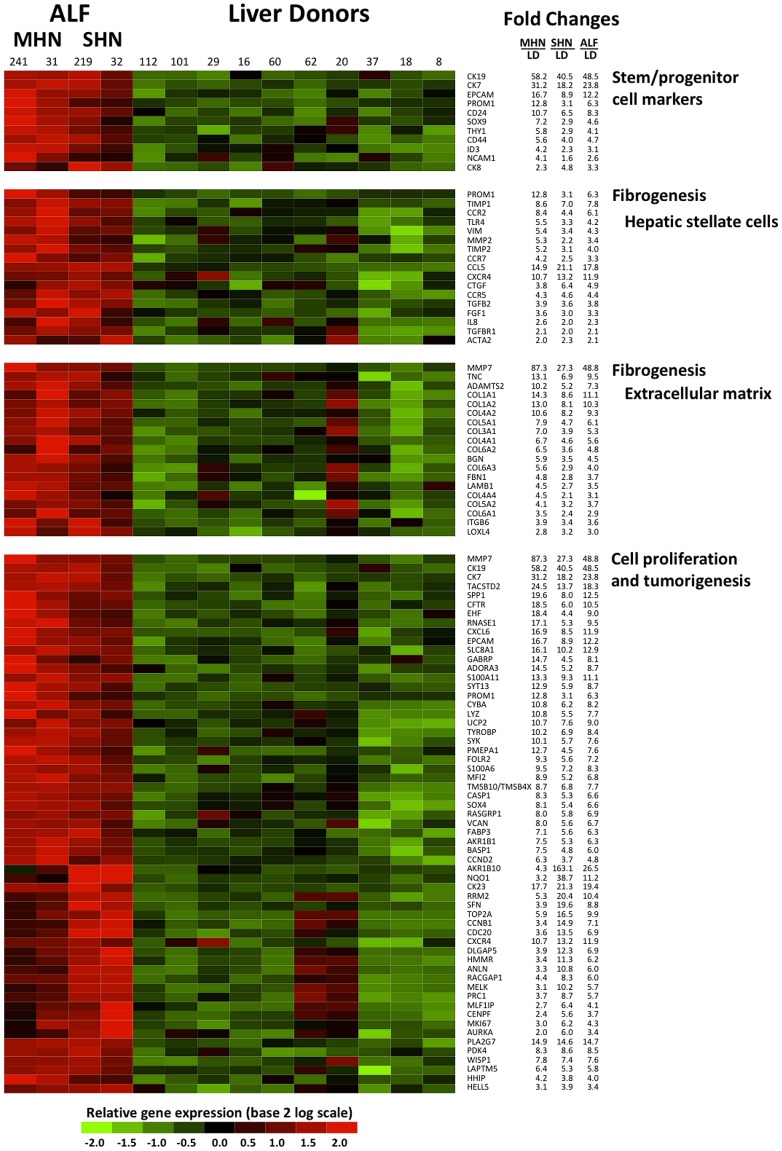
Figure 5. Differential gene expression between HBV-associated ALF and liver donors showing the up-regulated transcripts related to liver regeneration.
Data of the 10 liver donors represent individual samples, whereas data of the 4 ALF patients represent the average of multiple samples analyzed (up to 5 liver specimens for each patient). Each cell represents the expression of a particular transcript (rows) of a particular liver specimen (columns). The color in each cell reflects the level of expression of the corresponding gene in the corresponding sample, relative to its mean level of expression in the entire set of 14 samples. Ratios were log2-transformed and row-wise standardized. According to the color scale, up-regulated genes are shown in shades of red, down-regulated genes in shades of green. MHN denotes massive hepatic necrosis. SHN denotes submassive hepatic necrosis. LD denotes liver donors.

