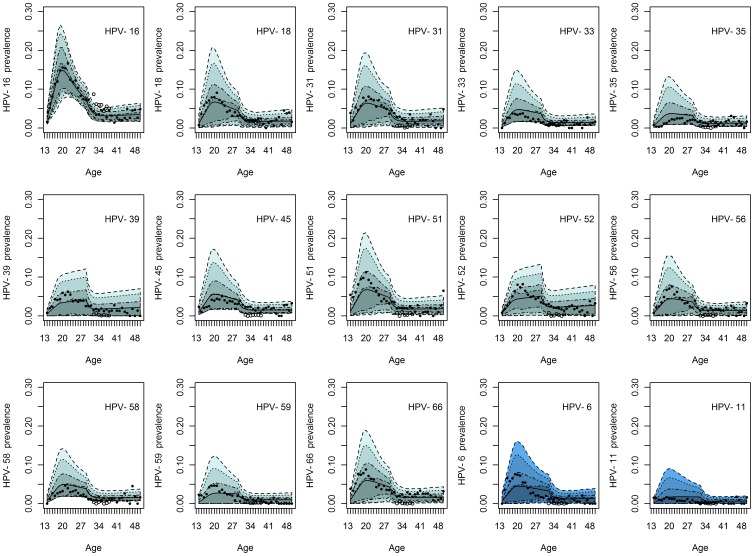
Figure 2. The predicted endemic prevalence of type-specific HPV infection in sexually active women and the observed prevalence in both women attending voluntary Chlamydia screening (solid dots) and those tested at baseline in the Swedescreen study (hollow dots).
The median predicted prevalence for each type is represented by the solid curve and the turquoise bands represent the 50%, 70%, 90% and 95% posterior intervals.

