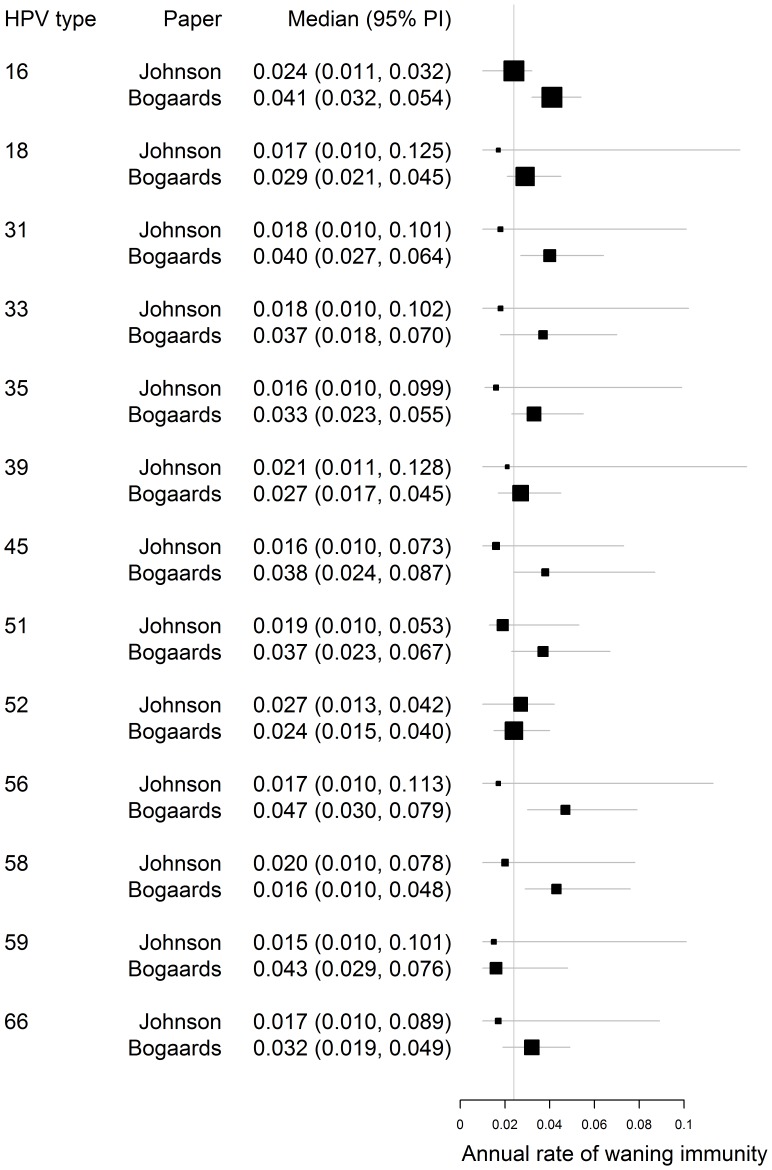
Figure 6. Comparison of the estimated annual rates of waning immunity for 13 high-risk types of HPV with those estimated by Bogaards et al.
[22] . The vertical line signifies the average of the posterior median estimates across all types in both studies.

