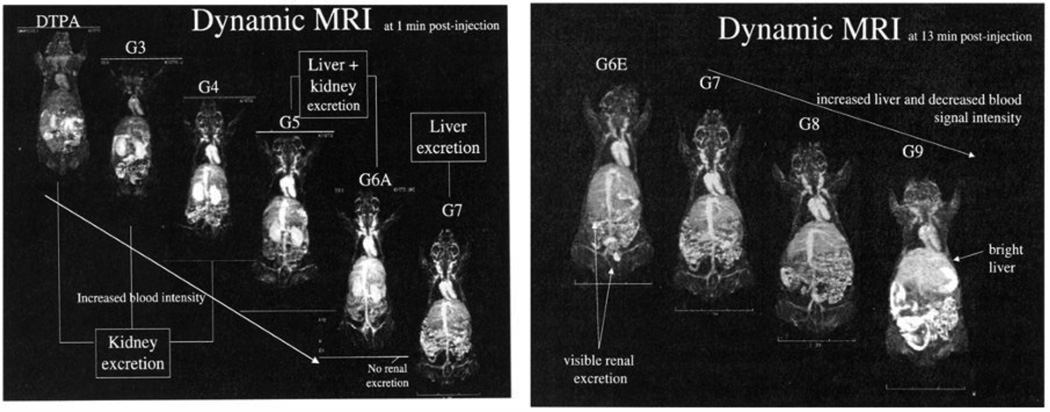
Fig. 1.
Elimination of dendrimer-based contrast agents as a function of size (generation), using T1-weighted dynamic MRI. Left, coronal image of mice after intravenous administration (t = 1 min), with high levels of renal contrast observed for dendrimers up to the 6th generation (dh < 10 nm). Right, coronal image of mice inoculated with higher-generation dendrimers (dh > 10 nm, t = 13 min) showing increased liver contrast. ©2003 Decker Publishing Inc. (reprinted with permission) [50].

