Figure 2.

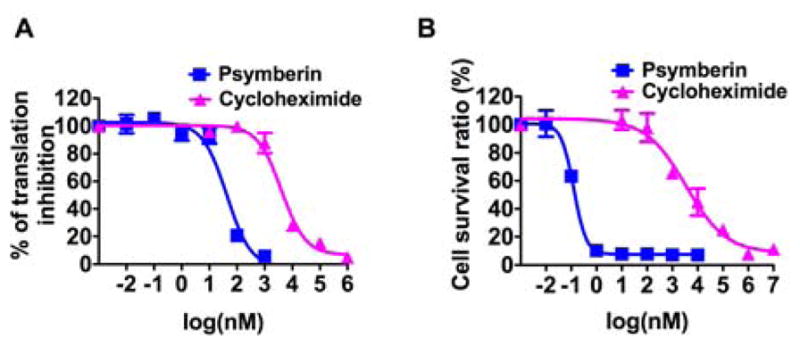
A. Representative translation-inhibition curves from a cell-based assay. B. Representative cytotoxicity curves from the cell-based CellTiter-Glo® assay. Means with standard deviations are plotted for each treatment condition.

A. Representative translation-inhibition curves from a cell-based assay. B. Representative cytotoxicity curves from the cell-based CellTiter-Glo® assay. Means with standard deviations are plotted for each treatment condition.