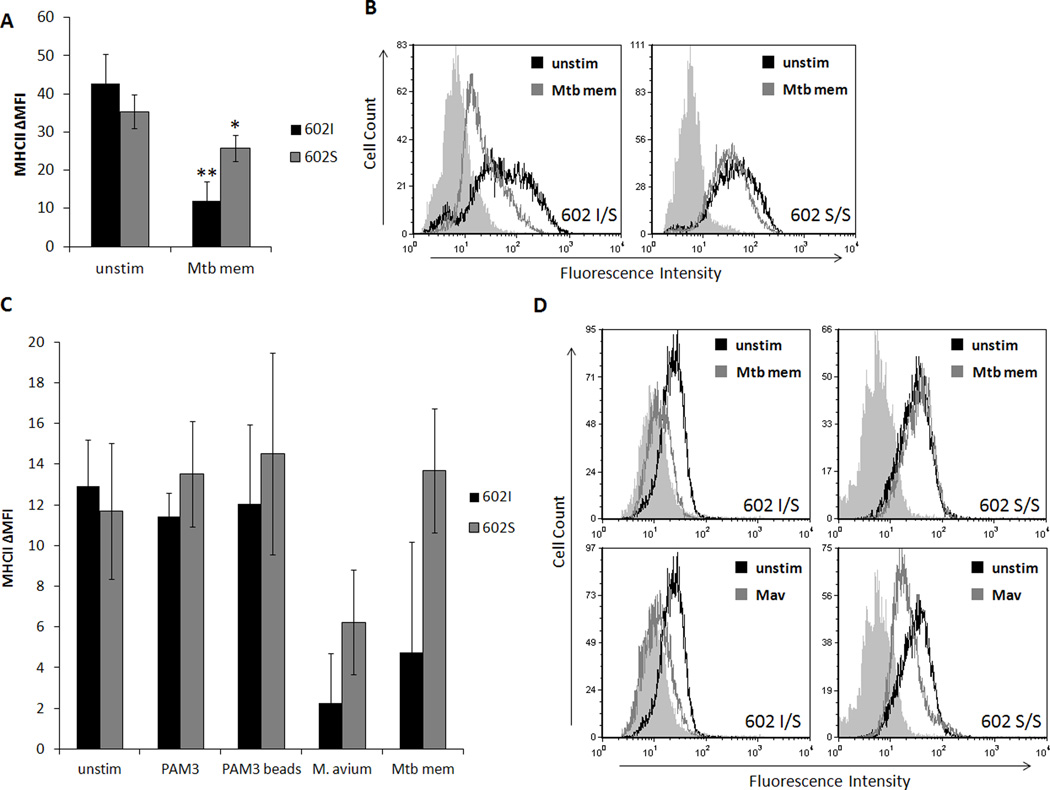
Figure 3. TLR1 602S/S macrophages resist downregulation of MHCII in response to soluble, but not whole mycobacterial agonists.
A. Primary human monocytes of different TLR1 602 genotypes were incubated with or without M. tuberculosis membrane fraction (Mtb mem) for 24 hours. Surface levels of MHCII were assessed by flow cytometry (black bars; TLR1 602I/I or I/S, gray bars; TLR1 602S/S). Error bars represent the standard deviation from at least three different blood donors. Asterisks denote significant differences versus unstimulated cells (*p<0.05, **p<0.005). B. Representative histograms of monocyte MHCII expression (filled histograms; isotype, black histograms; unstimulated cells, gray histograms; stimulated with Mtb membrane fraction). C. Primary human monocyte-derived macrophages were stimulated with soluble and particulate TLR1/2 agonists for 24 hours and surface levels of MHCII were assessed by flow cytometry (black bars; TLR1 602I/I or I/S, gray bars; TLR1 602S/S). Error bars represent the standard deviation from at least three blood donors. Asterisks denote significant differences versus unstimulated cells (*p<0.05). D. Representative histograms from indicated genotypes (filled histograms; isotype, black histograms; unstimulated cells, gray histograms; stimulated cells). (Mtb mem; mycobacterial membrane fraction, Mav; Mycobacterium avium)

