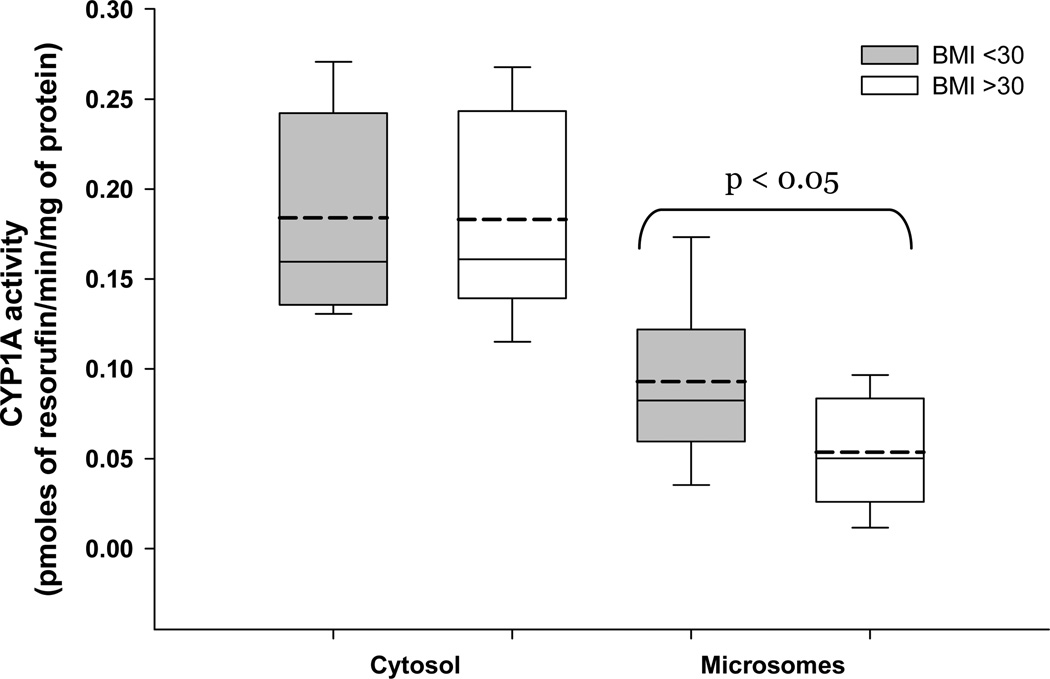
Figure 3. Maternal obesity and placental CYP1A1.
Placental CYP1A1 activity in both cytosolic and microsomal sub-cellular fractions was measured and the activity was normalized to amount of protein. All placentas were obtained from non-smoking mothers with a BMI <30 (n=14) or BMI >30 (n=16). Each box represents inter quartile range with mean and median depicted as dotted and solid line, respectively. Whiskers represent 95% confidence interval. Statistical differences were tested using student’s t-test.

