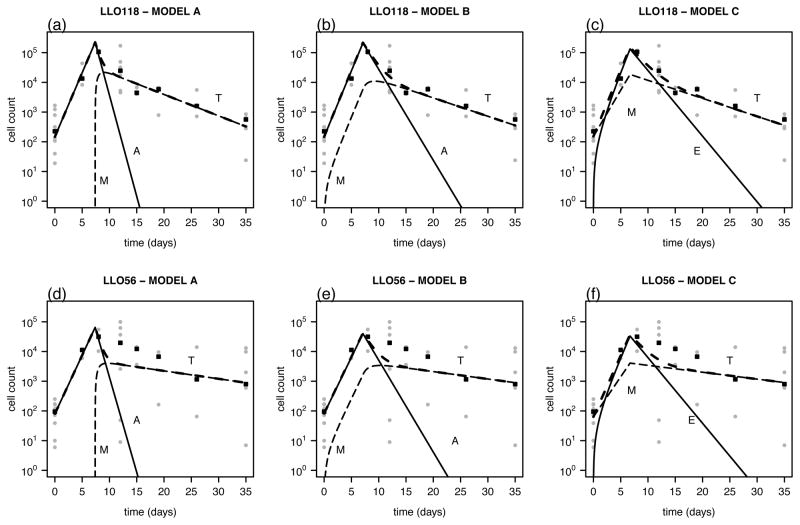
Figure 1.
Data and fitted curves for the CD4+ T cell count of LLO118 (upper row) and LLO56 cells (lower row). The actual measurements for each mouse (grey dots) and the median over all mice per time point are plotted (black squares) for the basic model (A, Eqs. (1a) and (1b), (a),(d)), a model assuming constant memory cell production during the proliferation phase (B, Eqs. (4a) and (4b), (b),(e)), and for a model assuming the alternative differentiation pathway (C, Eqs. (5a) and (5b), (c),(f)). The total number of CD4+ T cells (T, long-dashed line), the number of activated and effector CD4+ T cells, respectively (A, E solid line) and the number of memory cells (M, dashed line) are shown.

