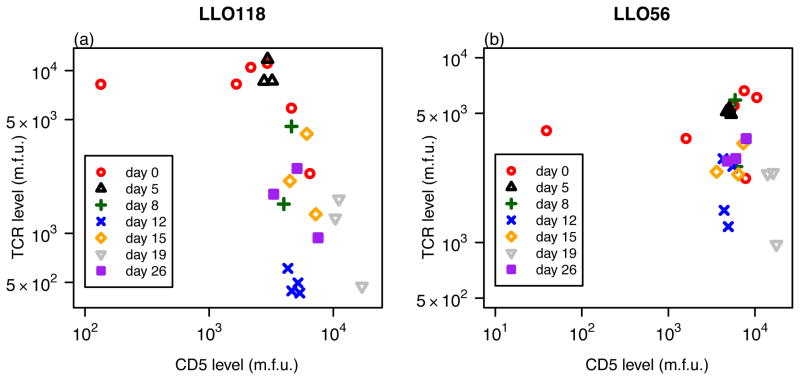
Figure 3.
The CD5 expression level measured in mean fluorescent units (m.f.u.) plotted against the TCR-level separately for LLO118 (a) and LLO56 (b). Each point represents one mouse. Symbols indicate the different time points at which mice were sampled. There is a significant correlation between CD5 and TCR-levels for LLO118 over all time points (ρ = −0.697, p = 2.3 × 10⁻⁴, Spearman). No correlation was found for LLO56 (ρ = −0.136, p = 0.53, Spearman).

