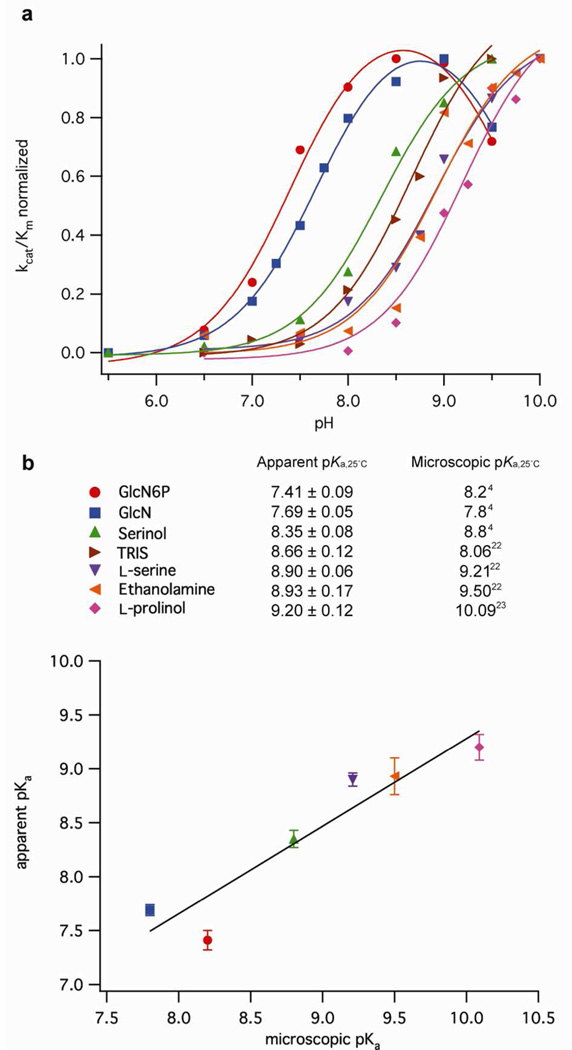
Figure 2.
Correlation of apparent pKa values determined from pH-rate profiles with microscopic pKa values for protonation of the cofactors in solution. a) Normalized pH-rate profiles for different cofactors were fit to Eq 3 or 4. Each point is the mean of two or more experiments. Normalized standard deviations ranged from 0.0002 to 0.28 (not shown for the sake of clarity). b) Linear correlation of apparent pKa values obtained from pH-rate profiles versus microscopic pKa values of the cofactors in solution. Errors correspond to the error of the fit in panel a.

