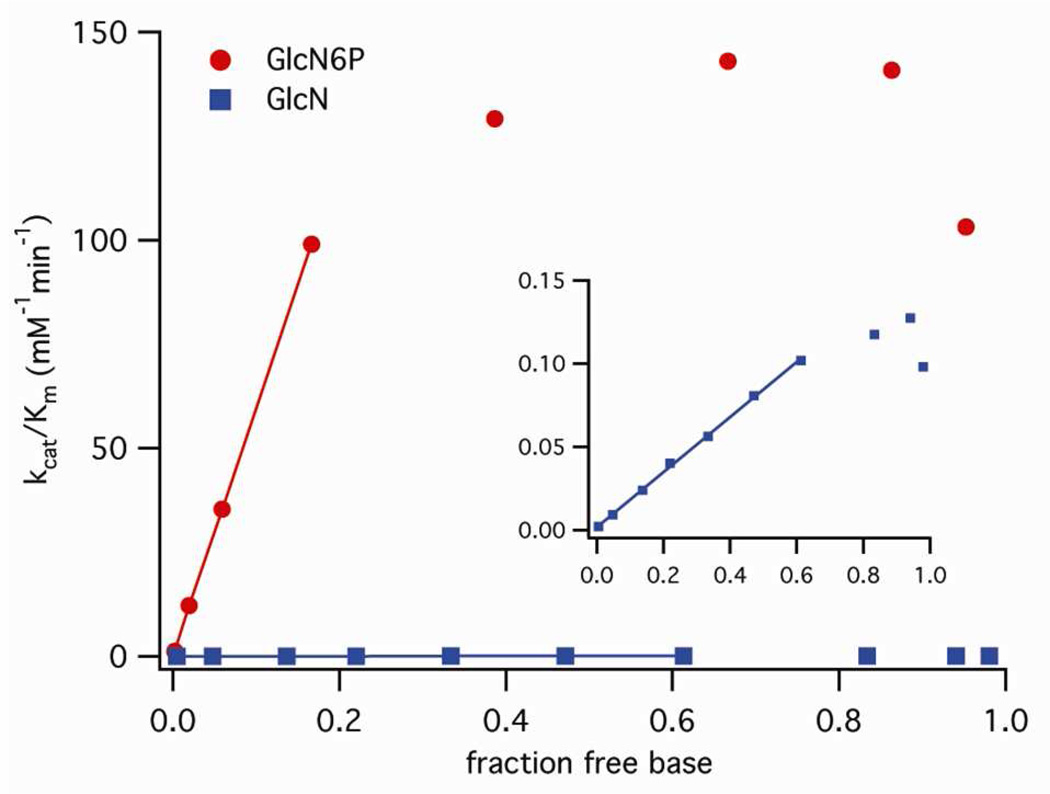
Figure 3.
Dependence of cleavage rates on the concentration of the free base form of the cofactors. Linear fits of second-order rate constants, kcat/Km, versus the fraction of the free base forms of GlcN6P and GlcN (for free base concentrations below apparent pKa values) intercept the origin. Each point represents the average of two or more experiments at a single pH.

