
Figure 1.
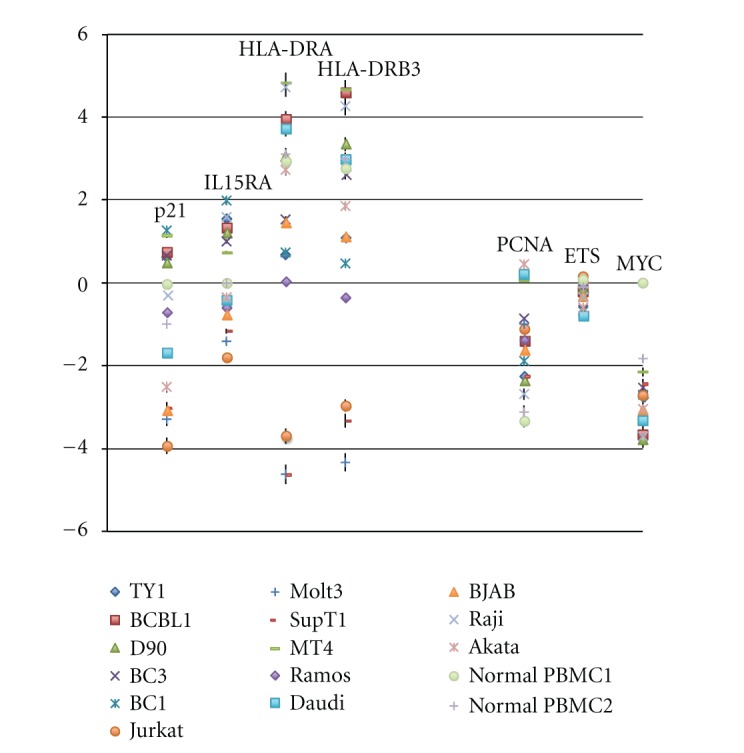
Genes increased or decreased in the presence of EBV [15] are picked up. The increased genes; p21Cip1/WAF1, IL15RA, HLA-DRA, and HLA-DRB3 were checked. The decreased genes: PCNA, ETS, and MYC (represented as N-myc in our case) were checked. Data are shown as log2 values with standard deviation. The concrete mean value of each gene expression was shown in Table 1.