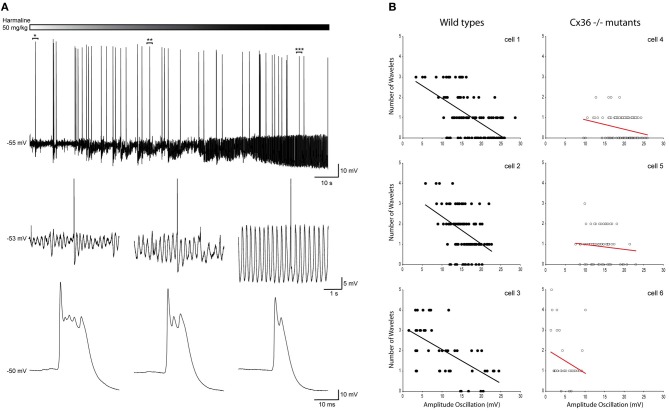
Figure 7.
Harmaline induced alteration of the oscillation amplitude confirms the negative relationship between the amplitude of the SSTOs and the number of wavelets on the ADP of olivary spikes within a single cell. (A) Top panel: trace of a spontaneous sinusoidal subthreshold oscillating olivary neuron (in vivo) during the application of harmaline. Middle panel: three magnifications obtained from the trace above. Magnifications were taken from the marked time windows (*, **, and ***) and show the effect of harmaline on the subhreshold oscillation. Lower panel: enlargement of the olivary action potential shown in the panel above. The number of the olivary wavelets on top of the afterdepolarization declines, while the amplitude of the oscillation increases. (B) Correlation between the amplitude of the SSTOs and the number of wavelets on the ADP of olivary spikes measured in cells from wild type (left panel) and from Cx36−/− mutant mice (right panel). Least squares linear regression lines and correlation coefficients were computed from each cell. Wild types (left panel) cell 1: r = −0.59, n = 116, and p < 0.01 (t-test); cell 2: r = −0.55, n = 143, and p < 0.01 (t-test); cell 3: r = −0.63, n = 46, and p < 0.01 (t-test). Cx36−/− mutants (right panel) cell 4: r = −0.04, n = 223, and p > 0.05 (t-test); cell 5: r = −0.14, n = 74, and p > 0.05 (t-test); cell 6: r = −0.23, n = 35, and p > 0.05 (t-test).

