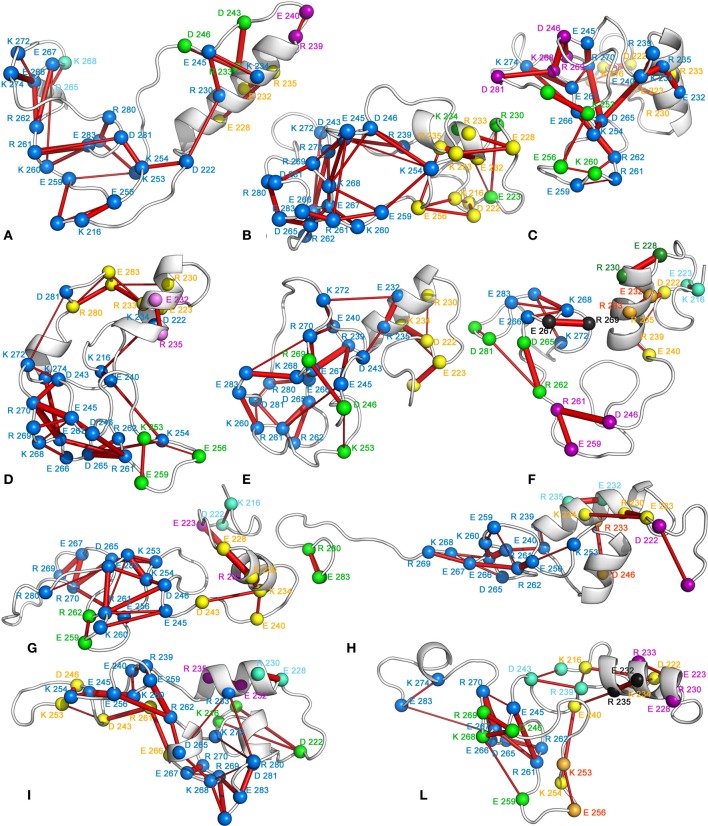
Figure 11.
Sub-networks of salt bridges. The 3D average structure of each FEL basin is shown as cartoon, and the Cα atoms of the residues involved in salt bridges are shown as spheres. The Cα atoms of the interacting residues are connected by sticks, whose thickness is proportional to the persistence of the interaction. The single sub-networks are represented by a color code according to their size blue-yellow-green-purple-cyan-orange-black-dark green, going from the largest (21 residues) to the smallest one (2 residues).

