
Figure 2.
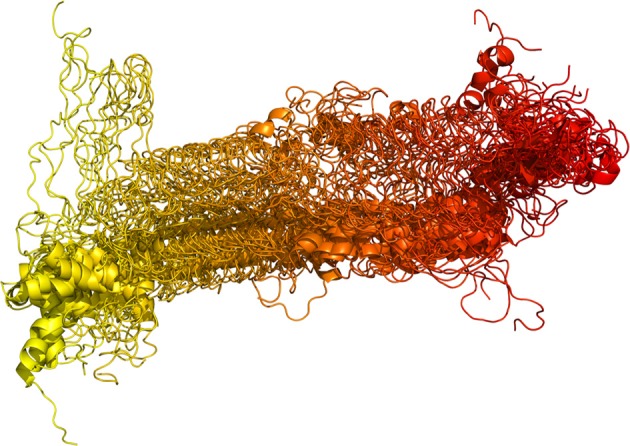
Structural displacement of the Sic1 KID domain in the MD macro-trajectory. The equilibrated parts of each replicate were concatenated in a single macro-trajectory of more than 0.5 μs, shown here. Snapshots are collected every 2 ns, overlaid and represented by a color gradient, from yellow (the starting structure of replicate 1) to red (the last frame of replicate 9).