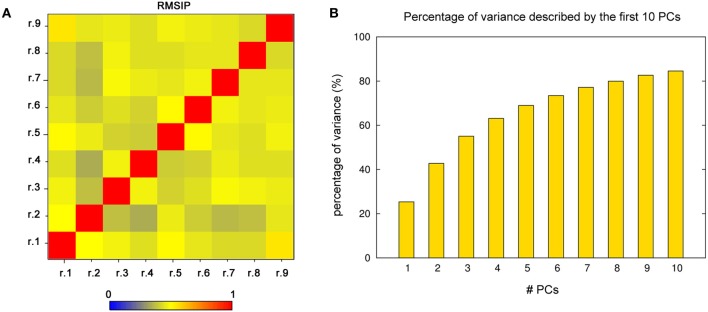
Figure 4.

PCA analysis. (A) RMSIP matrix calculated for each pairwise comparison of the single replicates, using the conformational space described by the first 10 PCs. The RMSIP values are highlighted by a color gradient, from blue to red. (B) Cumulative percentage of the variance described by the first ten PCs. The first three (or five) PCs account together for more than 50% (or 70%) of the global motions of the domain.
