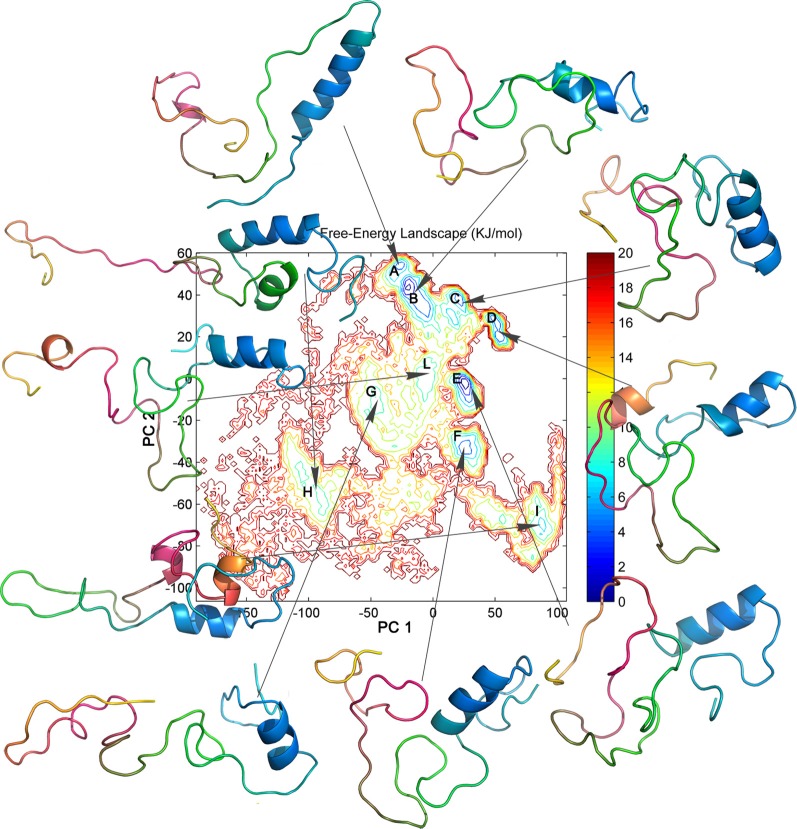
Figure 5.
FEL representation calculated using the first two PCs as reaction coordinates. The major basins are labeled by capital letters (A to L). The free energy is given in kJ/mol and indicated by the color code shown on the figure. The average 3D structure identified for each conformational basin by structural clustering is represented as cartoon. The 3D structures are highlighted by a color gradient, from N-terminus (cyan) to C-terminus (yellow).

