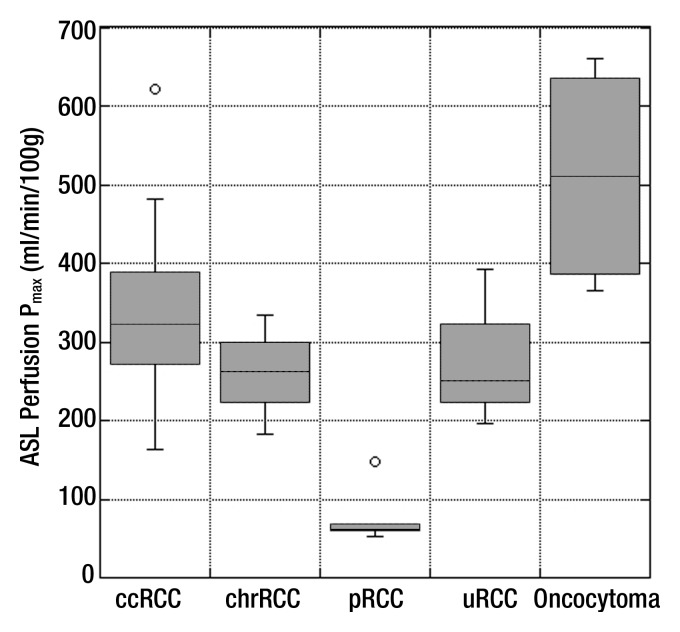
Figure 2:
Box plot of peak ASL perfusion levels (Pmax) according to histologic type. Boxes depict interquartile ranges, bounded inferiorly by the first quartile and superiorly by the third quartile. Horizontal lines within boxes represent the median. Smallest and largest nonoutlier values are marked with horizontal ticks, which are connected to boxes with a vertical line. Boxes depict interquartile ranges, bounded inferiorly by the first quartile and superiorly by the third quartile. Horizontal lines within boxes represent the median. Open circles denote outliers. ccRCC = clear cell RCC, chrRCC = chromophobe RCC, pRCC = papillary RCC, uRCC = unclassified RCC.

