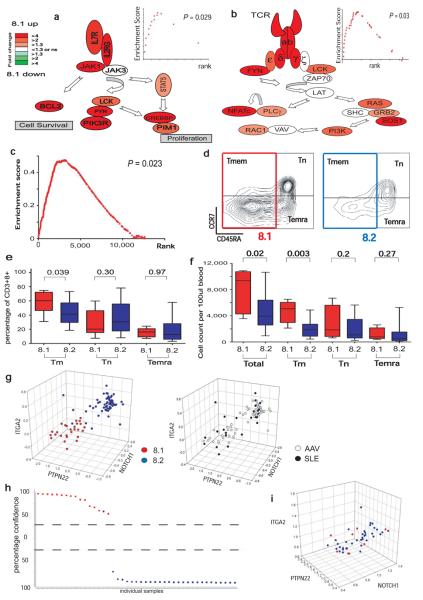
Figure 4. Poor prognosis in AAV correlates with over expression of mRNAs encoding proteins associated with T cell survival and memory.
(a, b) Magnitude and direction of differential gene expression between subgroups v8.1 and v8.2 for genes of (a) IL7R pathway (b) TCR signalling pathway. FDR p<0.05 and fold-change as illustrated by colour heatmap. Significance of enrichment was tested for the IL7R pathway (GSEA p=0.029, inset), Jak/Stat signalling pathway (Ingenuity, p<0.01, FDR<0.05, data not shown) and TCR signalling pathway (GSEA p=0.03, Ingenuity hypergeometric FDR p<0.05). (c) GSEA identified significant enrichment of a CD8 TEM signature in v8.1, p=0.023. (d) Memory T cell subsets of representative individuals from v8.1 (left panel) and v8.2 (right panel). Cells gated on CD3+ CD8+ showing naïve (TN, CD45RA+ CCR7+), memory (TMEM, CD45RA−) and effector memory RA (TEMRA, CCR7− CD45RA+) populations as indicated. (e, f) Boxplots showing relative proportions (e) and absolute numbers (f) of total, memory, naïve and effector memory-RA CD8 T cells in the two subgroups. (g) 3D scatterplots showing the classification of combined SLE and AAV samples using CD8 expression data from 3 genes (ITGA2, NOTCH1, PTPN22) separating patients by prognostic subgroups in both diseases (left panel) with no differentiation between diseases (right panel). mRNA expression on x, y and z axes as log2 ratio. (h) A predictive model was derived using a support vector machines algorithm on a randomized, stratified 50% subset of all samples (training set) and its performance assessed on the remaining 50% (test set), shown in (h), PPV=94%, NPV=100%. y-axis = confidence of prediction (%). (i) 3D scatterplot of the AAV cohort by the same 3-gene classifer using PBMC-derived gene expression data.

