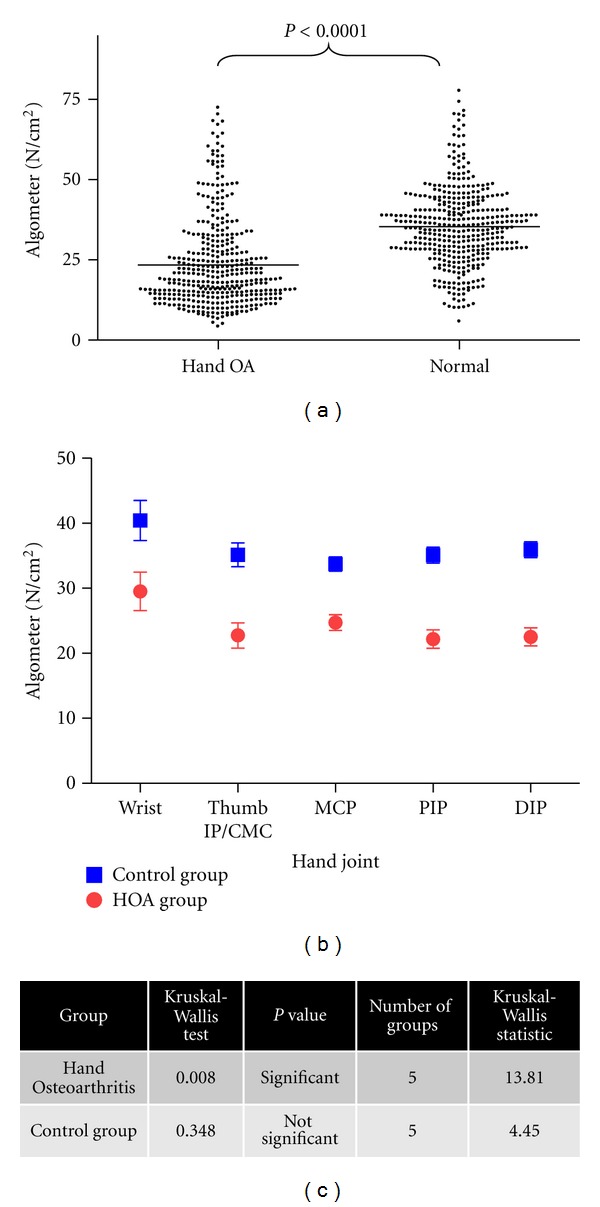
Figure 2.

Pain threshold analysis in hand OA and control group. (a) Plot of algometer scores in Newtons per square cm (N/cm2) for a total of 780 joints in the hand OA participants and controls is shown. Each point represents one hand joint region algometer score with mean values indicated by the solid line. (b) Subgroup analysis of data in hand OA and control groups stratified according to joint region involved. The 5 subgroups include wrist, thumb 1st CMC/IP, MCPs, PIPs, and DIPs. Data plotted are mean ± SEM. SEM was used to account for the varying number of joints between different groups (c). Statistical comparison between groups is shown in (b). The Kruskal-Wallis test was used to evaluate statistical significance between the subgroups within the hand OA and control groups. A significant difference between groups was considered at P ≤ 0.05.
