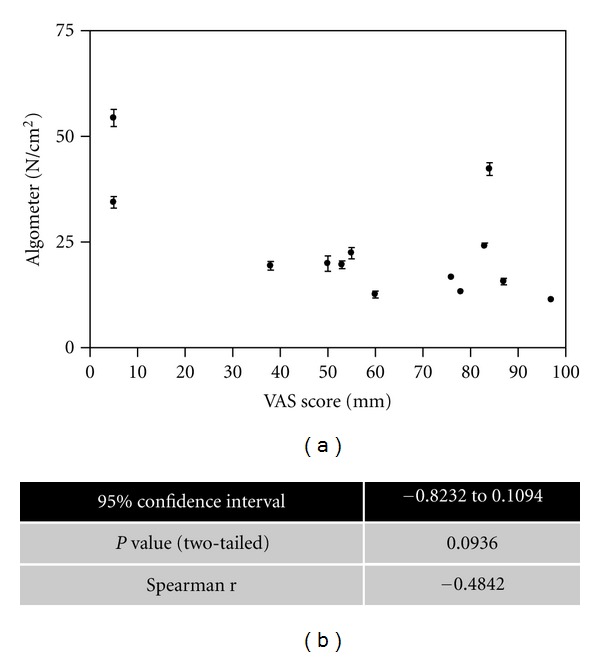
Figure 3.

Correlation analysis between VAS and algometer scores. A correlation plot for hand OA participants between VAS scores (mean ± SD) and algometer scores is shown. Spearman correlation analysis for statistical significance is shown. A significant difference between groups was considered at P ≤ 0.05.
