Figure 1.

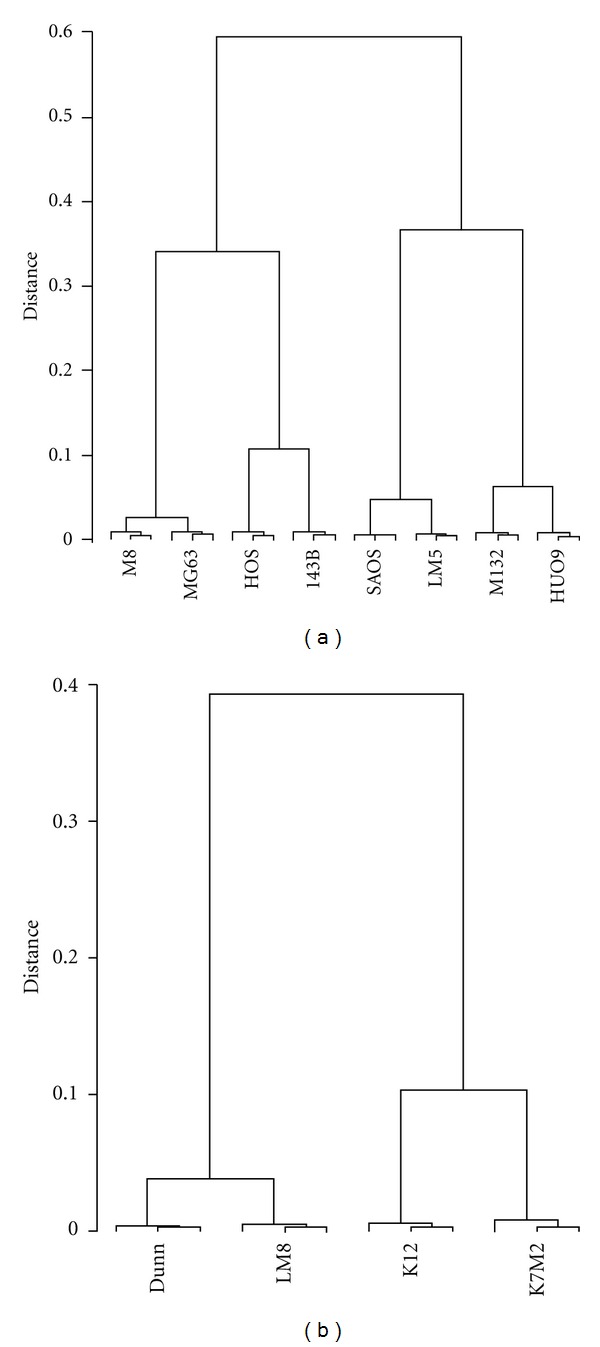
(a) Dendrogram of gene expression levels in the four human OS cell line systems. (b) Dendrogram of gene expression levels in the two mouse OS cell line systems. All probe sets on the arrays were included in the analysis.

(a) Dendrogram of gene expression levels in the four human OS cell line systems. (b) Dendrogram of gene expression levels in the two mouse OS cell line systems. All probe sets on the arrays were included in the analysis.