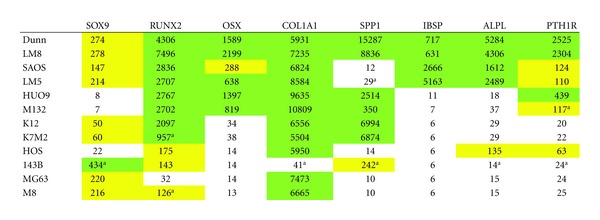
Table 3.
Microarray mRNA expression levels of osteoblastic marker genes.

|
Results are means of the probe sets listed below and analyzed in triplicates. a >2-fold (P < 0.05) versus parental cell line. White, low expression (<50): yellow, intermediate expression (50–300); green, high expression (>300). Probe sets (human/mouse): SOX9 (202935_s_at/1451538_at) RUNX2 (232231_at/1424704_at); OSX (1552340_at/1418425_at); COL1A1 (1556499_s_at/1423669_at); SPP1 (209875_s_at/1449254_at); IBSP (236028_at/1417484_at); ALPL (215783_s_at/1423611_at); PTH1R (205911_at/1417092_at).
