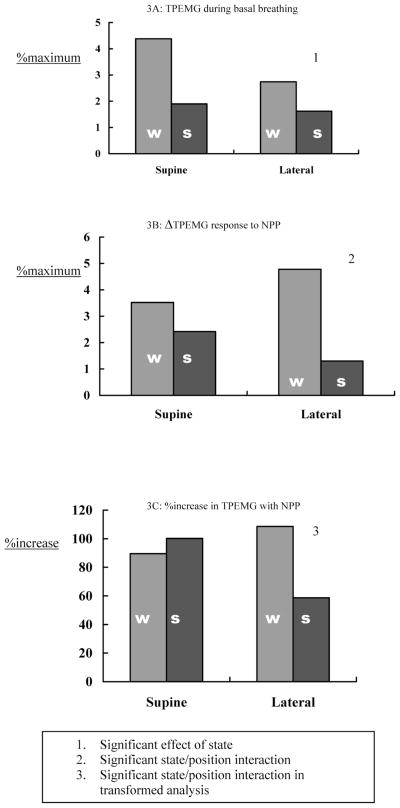
Figure 3.
Tensor Palatini Group Data. This figure illustrates group data for tensor palatini electromyogram (TPEMG) activity during basal breathing (3A) and following negative pressure pulses expressed both as an absolute change (Δ, 3B) and as a percentage increase (%increase) (2C). w refers to wakefulness; s, stable non-rapid eye movement sleep; %maximum, percentage of maximum.

